UNITED STATES
SECURITIES AND EXCHANGE COMMISSION
Washington, D.C. 20549
FORM 10-K
SECURITIES EXCHANGE ACT OF 1934
For the fiscal year ended December 31, 2019
OR
SECURITIES EXCHANGE ACT OF 1934
For the transition period from to
Commission File No. 001-16111

(Exact name of registrant as specified in charter)
(State or other jurisdiction of incorporation or organization) | (I.R.S. Employer Identification No.) | |
, | , | |||||
(Address of principal executive offices) | (Zip Code) | |||||
Registrant's telephone number, including area code: 770 -829-8000
Securities registered pursuant to Section 12(b) of the Act:
Title of each class | Trading symbol | Name of each exchange on which registered | ||
Securities registered pursuant to Section 12(g) of the Act:
NONE
Indicate by check mark if the registrant is a well-known seasoned issuer, as defined in Rule 405 of the Securities Act. Yes ☒ No ☐
Indicate by check mark if the registrant is not required to file reports pursuant to Section 13 or 15(d) of the Act. Yes ☐ No ☒
Indicate by check mark whether the registrant (1) has filed all reports required to be filed by Section 13 or 15(d) of the Securities Exchange Act of 1934 during the preceding 12 months (or for such shorter period that the registrant was required to file such reports), and (2) has been subject to such filing requirements for the past 90 days. Yes ☒ No ☐
Indicate by check mark whether the registrant has submitted electronically every Interactive Data File required to be submitted pursuant to Rule 405 of Regulation S-T (§ 232.405 of this chapter) during the preceding 12 months (or for such shorter period that the registrant was required to submit such files). Yes ☒ No ☐
Indicate by check mark whether the registrant is a large accelerated filer, an accelerated filer, a non-accelerated filer, a smaller reporting company or an emerging growth company. See the definitions of “large accelerated filer,” “accelerated filer,” “smaller reporting company” and “emerging growth company" in Rule 12b-2 of the Exchange Act.
Non-accelerated filer ☐ Smaller reporting company ☐
Emerging growth company ☐
If an emerging growth company, indicate by check mark if the registrant has elected not to use the extended transition period for complying with any new or revised financial accounting standards provided pursuant to Section 13(a) of the Exchange Act. ☐
Indicate by check mark whether the registrant is a shell company (as defined in Rule 12b-2 of the Act). Yes ☐ No ☒
The aggregate market value of the voting and non-voting common equity held by non-affiliates computed by reference to the price at which the common equity was last sold, or the average bid and asked price of such common equity, as of the last business day of the registrant's most recently completed second fiscal quarter was $24,916,809,935 . The number of shares of the registrant's common stock outstanding at February 19, 2020 was 299,627,279 shares.
DOCUMENTS INCORPORATED BY REFERENCE
Specifically identified portions of the registrant's proxy statement for the 2020 annual meeting of shareholders are incorporated by reference in Part III.
GLOBAL PAYMENTS INC.
2019 ANNUAL REPORT ON FORM 10-K
Page | |||
PART I | |||
ITEM 1. | |||
ITEM 1A. | |||
ITEM 2. | |||
ITEM 3. | |||
PART II | |||
ITEM 5. | |||
ITEM 6. | |||
ITEM 7. | |||
ITEM 7A. | |||
ITEM 8. | |||
ITEM 9. | |||
ITEM 9A. | |||
PART III | |||
ITEM 10. | |||
ITEM 11. | |||
ITEM 12. | |||
ITEM 13. | |||
ITEM 14. | |||
PART IV | |||
ITEM 15. | |||
CAUTIONARY NOTICE REGARDING FORWARD-LOOKING STATEMENTS
Unless the context requires otherwise, references in this report to "Global Payments," the "Company," "we," "our" or "us," refer to Global Payments Inc. and its subsidiaries.
Some of the statements we use in this report, and in some of the documents we incorporate by reference in this report, contain forward-looking statements concerning our business operations, economic performance and financial condition, including in particular: our business strategy and means to implement the strategy; measures of future results of operations, such as revenues, expenses, operating margins, income tax rates, and earnings per share; other operating metrics such as shares outstanding and capital expenditures; our success and timing in developing and introducing new services and expanding our business; and statements about the benefits of our acquisitions, including future financial and operating results, the combined company’s plans, objectives, expectations and intentions, and the successful integration of our future acquisitions. You can sometimes identify forward-looking statements by our use of the words "believes," "anticipates," "expects," "intends," "plan," "forecast," "guidance" and similar expressions. For these statements, we claim the protection of the safe harbor for forward-looking statements contained in the Private Securities Litigation Reform Act of 1995.
Although we believe that the plans and expectations reflected in or suggested by our forward-looking statements are reasonable, those statements are based on a number of assumptions, estimates, projections or plans that are inherently subject to significant risks, uncertainties and contingencies, many of which are beyond our control, cannot be foreseen and reflect future business decisions that are subject to change. Accordingly, we cannot guarantee you that our plans and expectations will be achieved. Our actual revenues, revenue growth rates and margins, other results of operations and shareholder values could differ materially from those anticipated in our forward-looking statements as a result of many known and unknown factors, many of which are beyond our ability to predict or control. Important factors, among others, that may otherwise cause actual events or results to differ materially from those anticipated by such forward-looking statements include failure to realize the expected benefits of the merger with Total System Services, Inc. ("TSYS") or difficulties integrating the business of the combined company, higher than anticipated costs related to integrating the businesses, business disruptions or the risk of customer loss related to the merger with TSYS, our ability to safeguard our data; increased competition from larger companies and non-traditional competitors, our ability to update our services in a timely manner; our ability to maintain Visa and Mastercard registration and financial institution sponsorship; our reliance on financial institutions to provide clearing services in connection with our settlement activities; our potential failure to comply with card network requirements; risk associated with our indebtedness; potential systems interruptions or failures; software defects or undetected errors; increased attrition of merchants, referral partners or independent sales organizations; our ability to increase our share of existing markets and expand into new markets; development of market trends and technologies; a decline in the use of cards for payment generally; unanticipated increases in chargeback liability; increases in credit card network fees; change in laws, regulations or network rules or interpretations thereof; foreign currency exchange and interest rate risks; political, economic and regulatory changes in the foreign countries in which we operate; future performance, integration and conversion of acquired operations, including without limitation, difficulties and delays in integrating or fully realizing cost savings and other benefits of our acquisitions at all or within the expected time period; fully realizing anticipated annual interest expense savings from refinancing our credit facilities; our loss of key personnel and other risk factors presented in Item "1A - Risk Factors of this Annual Report on Form 10‑K," which we advise you to review. These cautionary statements qualify all of our forward-looking statements, and you are cautioned not to place undue reliance on these forward-looking statements.
Our forward-looking statements speak only as of the date they are made and should not be relied upon as representing our plans and expectations as of any subsequent date. While we may elect to update or revise forward-looking statements at some time in the future, we specifically disclaim any obligation to publicly release the results of any revisions to our forward-looking statements, except as required by law.
3
PART I
ITEM 1- BUSINESS
Global Payments, Inc. and its consolidated subsidiaries are referred to collectively as "Global Payments," the "Company," "we," "our" or "us," unless the context requires otherwise.
Introduction
We are a leading pure play payments technology company providing cutting edge payments and software solutions to approximately 3.5 million merchant locations and more than 1,300 financial institutions across more than 100 countries throughout North America, Europe, Asia-Pacific and Latin America. Our technologies, services and employee expertise enable us to provide a broad range of solutions that allow our customers to operate their businesses more efficiently across a variety of channels around the world. Headquartered in Georgia with approximately 24,000 employees worldwide, Global Payments is a member of the S&P 500. Our common stock is traded on the New York Stock Exchange under the symbol "GPN."
Merger with Total System Services, Inc.
On September 18, 2019, we consummated our merger with Total System Services, Inc. ("TSYS") (the "Merger") for total purchase consideration of $24.5 billion, primarily funded with shares of our common stock. Prior to the Merger, TSYS was a leading global payments provider, offering seamless, secure and innovative solutions to issuers, merchants and consumers. See "Note 2—Acquisitions" in the notes to the accompanying consolidated financial statements for further discussion of the Merger.
Industry Overview
The payments technology industry provides financial institutions, businesses and consumers with payment processing services, merchant acceptance solutions and related information and other value-added services. The industry continues to grow as a result of wider merchant acceptance, increased consumer use of credit and debit cards and advances in payment processing technology. The proliferation of credit and debit cards, as well as other digital payment solutions, has made the acceptance of electronic payments a virtual necessity for many businesses, regardless of size, in order to remain competitive. This increased use of cards and the availability of more sophisticated technology services to all market segments has resulted in a highly competitive and specialized industry.
Strategy
We seek to leverage the adoption of, and transition to, card, electronic and digital-based payments by expanding our share in our existing markets through our distribution channels and service innovation, as well as through acquisitions to improve our offerings and scale. We also seek to enter new markets through acquisitions, alliances and joint ventures around the world. We intend to continue to invest in and leverage our technology infrastructure and our people to increase our penetration in existing markets.
The key tenets of our strategy include the following:
• | Grow and control our direct distribution by adding new channels and partners, including expanding our ownership of additional enterprise software solutions with a payments overlay in select vertical markets; |
• | Deliver innovative services by developing value-added applications, enhancing existing services and developing new systems and services to blend technology with customer needs; |
• | Continue to develop seamless multinational solutions for leading global customers; |
• | Leverage technology and operational advantages across our business segments and throughout our global footprint; |
• | Provide customer service at levels that exceed our competition, while investing in technology, training and enhancements to our service offerings; and |
• | Pursue potential domestic and international acquisitions of, investments in and alliances with companies that have |
4
high growth potential, significant market presence, sustainable distribution platforms and/or key technological capabilities.
Competitive Strengths
We believe that our competitive strengths include the following:
• | Global Footprint and Distribution - Our worldwide presence allows us to focus our investments on markets with promising gross domestic product fundamentals and favorable secular trends, makes us more attractive to customers with international operations and exposes us to emerging innovations that we can adopt globally, while diversifying our economic risk. |
• | Technology Solutions - We provide innovative technology-based solutions, including enterprise software solutions, that enable our customers to operate their business more efficiently and simplify the payments process, regardless of the channel through which the transaction occurs. We believe our robust technology solutions will continue to differentiate us in the marketplace and will position us for continued growth. |
• | Scalable Operating Environment and Technology Infrastructure - We operate with a multi-channel, global technology infrastructure, which provides scalable and innovative service offerings and a consistent service experience to our merchants, customers, financial institutions and other partners worldwide, while also driving sustainable operating efficiencies. |
• | Strong, Long-lasting Partner Relationships - We have established strong, long-lasting relationships with many financial institutions, enterprise software providers, value-added resellers and other technology-based payment service providers, which enable us to deliver a set of diverse solutions to our customers. |
• | Disciplined Acquisition Approach - Our proven track record for selectively and successfully sourcing, completing and integrating acquired businesses in existing and new markets positions us well for future growth and as an attractive partner for potential acquisition targets. |
Business Segments
Prior to the completion of the Merger, we operated in three reportable segments: North America, Europe and Asia-Pacific. As a result of the Merger, we assessed changes in our internal management reporting structure to incorporate the acquired operations of TSYS and the effects it has on our reportable segments. In the fourth quarter of 2019, we realigned our reportable segments to reflect the changes. As of December 31, 2019, we operated in three reportable segments: Merchant Solutions, Issuer Solutions and Business and Consumer Solutions. See "Note 15—Segment Information" in the notes to the accompanying consolidated financial statements for additional information about our segments, including revenues, operating income and depreciation and amortization by segment as well as financial information about geographic areas in which we operate.
In general, our consolidated results do not reflect pronounced seasonality. However, revenues and operating income for each segment and/or geographic channel may reflect stronger or weaker quarters given the nature of the underlying customer portfolios. Our foreign operations subject us to various risks, including, without limitation, currency exchange risks and political, economic and regulatory risks. See "Item 1A-Risk Factors" for additional information about these risks.
Merchant Solutions Segment
Through our Merchant Solutions segment, we provide payments technology and software solutions to customers globally. Our payment technology solutions are similar around the world in that we enable our customers to accept card, electronic, check and digital-based payments. Our comprehensive offerings include, but are not limited to, authorization services, settlement and funding services, customer support and help-desk functions, chargeback resolution, terminal rental, sales and deployment, payment security services, consolidated billing and statements and on-line reporting.
In addition, we offer a wide array of enterprise software solutions that streamline business operations to customers in numerous vertical markets. We also provide a variety of value-added services, including specialty point-of-sale solutions, analytic and engagement tools, payroll services and reporting that assist our customers with driving demand and operating their businesses more efficiently.
5
Our value proposition is to provide distinctive high-quality, responsive and secure services to all of our customers. We distribute our Merchant Solutions services globally through multiple channels and target customers in many vertical markets located throughout North America, Europe, Asia-Pacific and Latin America. The majority of our revenues is generated by services priced as a percentage of transaction value or a specified fee per transaction, depending on the payment type or the market. We also earn software subscription and licensing fees, as well as other fees based on specific value-added services that may be unrelated to the number or value of transactions.
Our primary mode of distribution is our direct distribution channels, including an extensive direct sales force selling our services and solutions across numerous vertical markets. Our technology-enabled solutions represented a substantial component of our revenues in North America for the year ended December 31, 2019. Our technology-enabled distribution in North America includes integrated and vertical market software solutions and ecommerce and omnichannel solutions. Our ecommerce and omnichannel solutions represent a growing percentage of the services we sell in Europe.
Direct Distribution
Our primary business model in the Merchant Solutions segment is to actively market and provide our payment services, enterprise software solutions and other value-added services directly to our customers through a variety of distribution channels. We offer high-touch services that provide our customers with reliable and secure solutions coupled with high quality and responsive support services. Through our direct sales force worldwide, as well as bank partnerships, we offer our payments technology services, software and other value-added solutions directly to customers in the markets we serve.
Many of our payment solutions are technology-enabled in that they incorporate or are incorporated into innovative, technology-driven solutions, including enterprise software solutions, designed to enable merchants to better manage their businesses. Our primary technology-enabled solutions include integrated solutions, vertical market software solutions and ecommerce and omnichannel solutions, each as described below.
Global Payments Integrated Solutions. Our integrated solutions provide advanced payments technology that is deeply embedded into business management software solutions that are owned by our technology partners who operate in numerous vertical markets, primarily in North America. We grow our integrated solutions business when new or existing merchants enable payments services through enterprise software solutions sold by our partners. Through Ezidebit, we offer integrated payment technology solutions in the Asia-Pacific region that focus on recurring payments verticals.
Vertical Markets Software Solutions. Our vertical markets software solutions provide advanced payments technology that is deeply integrated into business enterprise software solutions that we own. We distribute our vertical markets software solutions primarily through the following businesses:
• | ACTIVE Network. Through ACTIVE Network, we deliver cloud-based enterprise software, including payment technology solutions, to event organizers in the communities and health and fitness markets. |
• | AdvancedMD. Through AdvancedMD, we provide cloud-based enterprise solutions to small-to-medium sized ambulatory physician practices in the United States. |
• | Education Solutions. We offer integrated payment solutions specifically designed for all levels of educational institutions. At the university level, we offer integrated commerce solutions, payment services, higher education loan services, credentialing services and open- and closed-loop payment solutions. For kindergarten through 12th grade, we provide ecommerce and in-person payments, cafeteria POS solutions and back-office management software, hardware, technical support and training. |
• | Gaming. We offer a comprehensive suite of cash access solutions to the gaming market in North America. These solutions include credit and debit card cash advance, traditional and electronic check processing and other services specific to this market. |
• | Xenial. Through Xenial, we offer leading-edge enterprise software solutions, integrated with our payment services and other adjacent business service applications, to the restaurant and hospitality and retail vertical markets. |
Ecommerce and Omnichannel. We offer ecommerce and omnichannel solutions to our customers that seamlessly blend payment gateway services, retail payment acceptance infrastructure and payment technology service capabilities through a unified commerce platform to allow merchants to accept various payment methods through any channel across our geographical footprint. We sell ecommerce and omnichannel solutions to customers of all sizes, from small businesses accepting payments
6
in a single country, to enterprise and multinational businesses that have complex payment needs and operate retail and online businesses in multiple countries.
Wholesale Distribution
Although our primary business model in the Merchant Solutions segment is to build high quality direct relationships with merchants, we also provide our services through a wholesale distribution channel where we do not maintain the face-to-face relationship with the merchant. Through our wholesale channel, our payment services are offered to merchants through independent sales organizations ("ISOs") and financial institutions.
Credit and Debit Card Transaction Processing
Credit and debit card transaction processing includes the processing of the world's major international card brands, including American Express, Discover Card ("Discover"), JCB, Mastercard, UnionPay International ("UPI") and Visa, as well as certain domestic debit networks, such as Interac in Canada. Credit and debit networks establish uniform regulations that govern much of the payment card industry. During a typical payment transaction, the merchant and the card issuer do not interface directly with each other, but instead rely on payments technology companies, such as Global Payments, to facilitate transaction processing services, including authorization, electronic draft capture, file transfers to facilitate funds settlement and certain exception-based, back office support services such as chargeback and retrieval resolution.
We process funds settlement under two models: a sponsorship model and a direct membership model. Under the sponsorship model, member clearing financial institutions ("Members") sponsor us and require our adherence to the standards of the networks. In certain markets, we have sponsorship or depository and clearing agreements with financial institution sponsors. These agreements allow us to route transactions under the Members' control and identification numbers to clear card transactions through Mastercard and Visa. In this model, the standards of the card networks restrict us from performing funds settlement or accessing merchant settlement funds, and, instead, require that these funds be in the possession of the Member until the merchant has been funded.
Under the direct membership model, we are direct members in various payment networks, allowing us to process and fund transactions without third-party sponsorship. In this model, we route and clear transactions directly through the card brand’s network and are not restricted from performing funds settlement. Otherwise, we process these transactions similarly to how we process transactions in the sponsorship model. We are required to adhere to the standards of the various networks in which we are direct members. We maintain relationships with financial institutions, which may also serve as our Member sponsors for other card brands or in other markets, to assist with funds settlement.
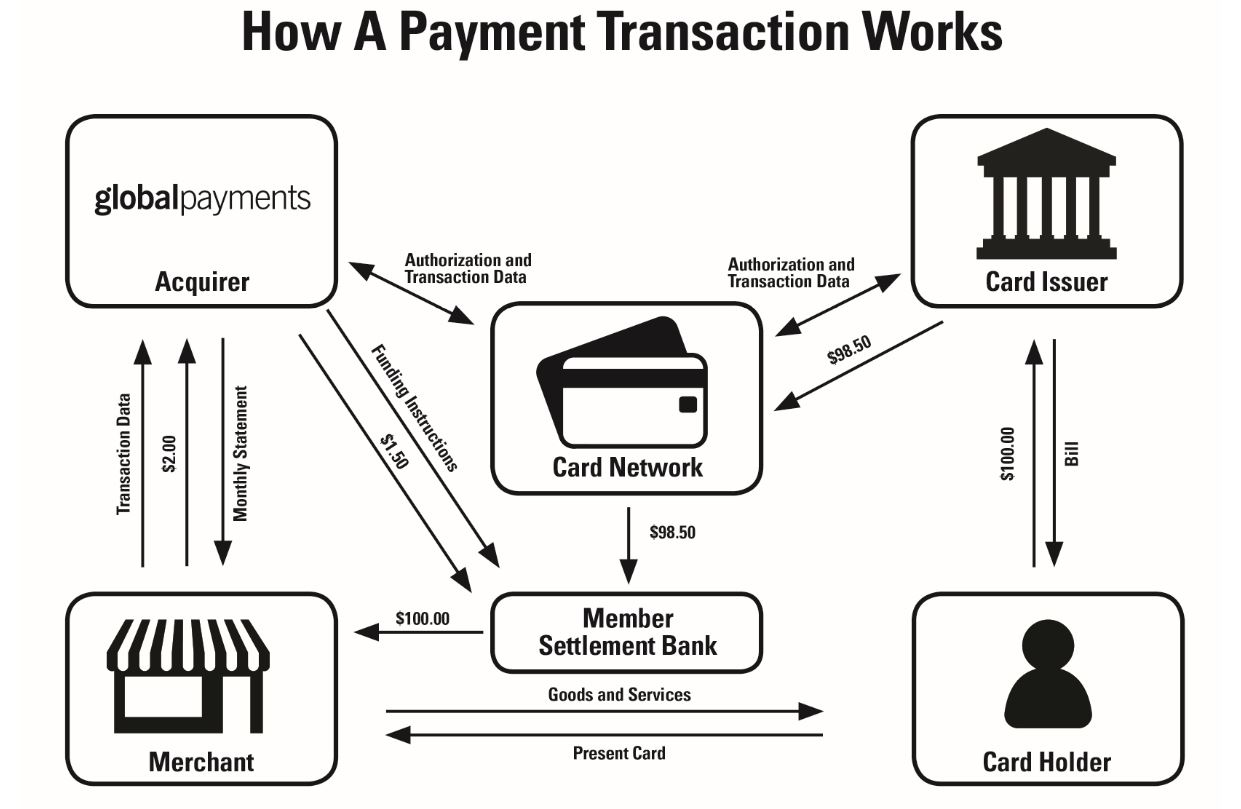
How a Card Transaction Works
A typical payment transaction begins when a cardholder presents a card for payment at a merchant location where the card information is captured by a point-of-sale ("POS") terminal card reader or mobile device card reader, which may be sold or leased to the merchant and serviced by us. Alternatively, card and transaction information may be captured and transmitted to our network through a POS device or ecommerce portal by one of a number of services that we offer directly or through a value-added reseller. The card reader electronically records sales draft information, such as the card identification number, transaction date and transaction amount.
After the card and transaction information is captured, the POS device automatically connects to our network through the internet or other communication channel in order to receive authorization of the transaction. For a credit card transaction, authorization services generally refer to the process in which the card issuer indicates whether a particular credit card is authentic and whether the impending transaction amount will cause the cardholder to exceed defined credit limits. In a debit card transaction, we obtain authorization for the transaction from the card issuer through the payment network verifying that the cardholder has access to sufficient funds for the transaction amount.
As an illustration, shown below, on a $100.00 card transaction, the card issuer may fund the Member, our sponsor, (indirectly through the card network) $98.50 after retaining approximately $1.50 referred to as an interchange fee. The card issuer seeks reimbursement of $100.00 from the cardholder in the cardholder's monthly credit card statement. The Member would, in turn, pay the merchant $100.00. The net settlement after this transaction would require us to advance the Member $1.50. After the end of the month, we would bill the merchant a percentage of the transaction amount, or merchant discount, to cover the full amount of the interchange fee and our fee from the transaction. If our discount rate for the merchant in the above example was 2.00%, we would bill the merchant $2.00 after the end of the month for the transaction, reimburse ourselves for $1.50 in interchange fees and retain $0.50 as our fees for the transaction. Under some arrangements, we remit the net amount
7
of $98.00 to the merchant, rather than funding the full $100.00 and subsequently billing the merchant at the end of the month. Discount rates vary based on negotiations with merchants and the economic characteristics of transactions. Interchange rates also vary based on the economic characteristics of individual transactions. Accordingly, our fee per transaction varies across our merchant base and is subject to change based on changes in discount rates and interchange rates. Our profit on the transaction reflects the fee received less payment network fees and operating expenses, including systems cost to process the transaction and commissions paid to our sales force or ISO. Payment network fees are charged by the card brands, in part, based on the value of transactions processed through their networks.
Issuer Solutions Segment
Through our Issuer Solutions segment, we provide solutions that enable financial institutions and other financial service providers to manage their card portfolios, reduce technical complexity and overhead and offer a seamless experience for cardholders on a single platform. In addition, we provide flexible commercial payments and ePayables solutions that support business-to-business payment processes for businesses and governments. We also offer complementary services including account management and servicing, fraud solution services, analytics and business intelligence, cards, statements and correspondence, customer contact solutions and risk management solutions.
Issuer Solutions segment revenues are derived from long-term processing contracts with financial institutions and other financial services providers. Payment processing services revenues are generated primarily from charges based on the number of accounts on file, transactions and authorizations processed, statements generated and/or mailed, managed services, cards embossed and mailed, and other processing services for cardholders accounts on file. Most of these contracts have prescribed annual minimums, penalties for early termination, and service level agreements that may affect contractual fees if specific service levels are not achieved. Issuer Solutions revenues also include loyalty redemption services and professional services.
Business and Consumer Solutions Segment
Our Business and Consumer Solutions segment provides general purpose reloadable ("GPR") prepaid debit and payroll cards, demand deposit accounts and other financial service solutions to the underbanked and other consumers and businesses in the United States through our Netspend® brand. Through our Business and Consumer Solutions segment, we provide customers with access to depository accounts insured by the Federal Deposit Insurance Corporation ("FDIC") with a menu of
8
features specifically tailored to their needs. Business and Consumer Solutions has an extensive distribution and reload network comprising financial service centers and other retail locations throughout the United States, and is a program manager for FDIC-insured depository institutions that provide the services that the Business and Consumer Solutions segment develops, promotes and distributes. Business and Consumer Solutions currently has active agreements with five card issuing banks.
The Business and Consumer Solutions segment markets its services through multiple distribution channels, including alternative financial service providers, traditional retailers, direct-to-consumer and online marketing programs and contractual relationships with corporate employers. Business and Consumer Solutions segment revenues principally consist of fees collected from cardholders and fees generated by cardholder activity in connection with the programs that we manage. Customers are typically charged a fee for each purchase transaction made using their cards, unless the customer is on a monthly or annual service plan, in which case the customer is instead charged a monthly or annual subscription fee, as applicable. Customers are also charged a monthly maintenance fee after a specified period of inactivity. We also charge fees associated with additional services offered in connection with our accounts, including the use of overdraft features, a variety of bill payment options, card replacement, foreign exchange and card-to-card transfers of funds initiated through our call centers. Revenues are recognized net of fees charged by the payment networks for services they provide in processing transactions routed through them.
Competition
Our Merchant Solutions segment competes with financial institutions and merchant acquirers who provide businesses with merchant acquiring services and related services. We believe that as of December 31, 2019, we were one of the largest merchant acquirers in the small and medium-sized business segment (merchants who have less than $5 million in annual bankcard sales volume) in the United States. In the United States, we compete primarily with Fiserv, Inc. (and its alliances) ("Fiserv"), Fidelity National Information Services, Inc. ("FIS"), Chase Paymentech Solutions, LLC, Elavon, Inc., a subsidiary of U.S. Bancorp, Wells Fargo Bank, N.A and Square, Inc. While these are our primary competitors, some of our vertically focused business in the United States compete with other organizations.
Internationally, financial institutions remain the primary providers of payment technology services to merchants, although the outsourcing of these services to third-party service providers is becoming more prevalent. Payment services have become increasingly complex, requiring significant capital commitments to develop, maintain and update the systems necessary to provide these advanced services at competitive prices. In addition to financial institutions, competitors in Europe include Ayden N.V. and FIS.
Our Issuer Solutions segment encounters competition from credit card processing firms, third-party card processing software vendors and various other firms that provide products and services to credit card issuers in the United States and internationally. The United States market for third-party processing for credit card issuers is primarily serviced by three vendors, including TSYS, with our largest competitor being a subsidiary of Fiserv. We believe that as of December 31, 2019, we were the largest third-party processor for credit card issuers in North America and one of the largest in Europe based on net revenue derived from solutions for credit card issuers.
Our Business and Consumer Solutions segment primarily competes with other demand deposit account and prepaid debit account program managers to provide financial service solutions to the underbanked and other consumers and businesses. Our primary competitors in this space include Green Dot Corporation, InComm and Fiserv. As of December 31, 2019, we believe that we were one of the two largest prepaid program managers in the United States based on gross dollar volume (total spending on the accounts we manage) processed during 2019.
Safeguarding Our Business
In order to provide our services, we process and store sensitive business information and personal information, which may include credit and debit card numbers, bank account numbers, social security numbers, driver’s license numbers, names and addresses, and other types of personal information or sensitive business information. Some of this information is also processed and stored by financial institutions, merchants and other entities, as well as third-party service providers to whom we outsource certain functions and other agents, which we refer to collectively as our associated third parties. We may have responsibility to the card networks, financial institutions, and in some instances, our merchants, ISOs and/or individuals, for our failure or the failure of our associated third parties (as applicable) to protect this information.
We are subject to cyber security and information theft risks in our operations, which we seek to manage through cyber and information security programs, training and insurance coverage. To strengthen our security and cyber defenses, we continue to deploy multiple methods at different layers to defend our systems against misuse, intrusions and cyberattacks and to protect the data we collect. Further, we work with information security and forensics firms and employ advanced technologies to help
9
prevent, investigate and address issues relating to processing system security and availability. We also collaborate with third parties, regulators and law enforcement, when appropriate, to resolve security incidents and assist in efforts to prevent unauthorized access to our processing systems.
Intellectual Property
Our intellectual property is an important part of our strategy to be a leading provider of payment technology and software solutions. We use a combination of internal policies, intellectual property laws and contractual provisions to protect our proprietary technologies and brands. In addition, to protect our various brands, we seek and maintain registration of U.S. and international patents, trademarks, service marks and domain names that align with our brand strategy. We also enforce our trademarks against potential sources of confusion that could harm our brand and ability to compete. In addition to using our intellectual property in our own operations, we grant licenses to certain of our customers to use our intellectual property.
Employees and Labor
As of December 31, 2019, we had approximately 24,000 employees, many of whom are highly skilled in technical areas specific to payment technology and software solutions.
Regulation
Various aspects of our business are subject to regulation and supervision under federal, state and local laws in the United States, such as the California Consumer Privacy Act (the "CCPA"), and foreign laws, regulations and rules, including Directive 2007/64/EC in the European Union (the "Payment Services Directive"), as well as local escheat laws and privacy and information security regulations. In addition, we are subject to rules promulgated by the various payment networks, including American Express, Discover, Interac, Mastercard and Visa. Set forth below is a brief summary of some of the significant laws and regulations that apply to us. These descriptions are not exhaustive, and these laws, regulations and rules frequently change and are increasing in number.
Dodd-Frank Act
The Dodd-Frank Wall Street Reform and Consumer Protection Act of 2010 (the "Dodd-Frank Act") restricts the amounts of debit card fees that certain institutions can charge merchants. Pursuant to regulations promulgated by the Federal Reserve Board, debit interchange rates for card issuers with assets of $10 billion or more are capped at $0.21 per transaction and an ad valorem component of 5 basis points to reflect a portion of the issuer's fraud losses plus, for qualifying issuers, an additional $0.01 per transaction in debit interchange for fraud prevention costs.
In addition, the Dodd-Frank Act limits the ability of payment card networks to impose certain restrictions because it allows merchants to: (i) set minimum dollar amounts (not to exceed $10) for the acceptance of a credit card (and allows federal governmental entities and institutions of higher education to set maximum amounts for the acceptance of credit cards) and (ii) provide discounts or incentives to encourage consumers to pay with cash, checks, debit cards or credit cards.
The rules also contain prohibitions on network exclusivity and merchant routing restrictions that require a card issuer to enable at least two unaffiliated networks on each debit card, prohibit card networks from entering into exclusivity arrangements and restrict the ability of issuers or networks to mandate transaction routing requirements. The prohibition on network exclusivity has not significantly affected our ability to pass on network fees and other costs to our customers, nor do we expect it to in the future.
The Dodd-Frank Act also created the Consumer Financial Protection Bureau ("CFPB"), which has assumed responsibility for enforcing federal consumer protection laws, and the Financial Stability Oversight Council, which has the authority to determine whether any nonbank financial company, such as us, should be supervised by the Board of Governors of the Federal Reserve System (the "Federal Reserve") on the ground that it is "systemically important" to the U.S. financial system. Accordingly, we may be subject to additional systemic risk-related oversight.
Money Transmission, Sale of Checks and Payment Instrument Laws and Regulations
Our Business and Consumer Solutions segment is subject to money transfer and payment instrument licensing regulations. We have obtained licenses to operate as a money transmitter, seller of checks and/or provider of payment instruments in 49 states and the District of Columbia.
10
Our Business and Consumer Solutions segment is subject to direct supervision and regulation by the relevant state banking departments or similar agencies charged with enforcement of the relevant statutes and we must comply with various requirements, such as those related to the maintenance of a certain level of net worth, surety bonding, selection and oversight of our authorized agents, maintaining permissible investments in an amount equal to or in excess of our outstanding payment obligations, recordkeeping and reporting and disclosures to consumers. Our Business and Consumer Solutions segment is also subject to periodic examinations by the relevant licensing authorities, which may include reviews of our compliance practices, policies and procedures, financial position and related records, various agreements that we have with our issuing banks, distributors and other third parties, privacy and data security policies and procedures and other matters related to our business.
Banking Laws and Regulations
Because we provide electronic payment processing services to banks and other financial institutions, we are subject to examination by the Federal Financial Institutions Examination Counsel (the "FFIEC"), an interagency body comprised primarily of federal banking regulators, and also subject to examination by the various state financial regulatory agencies that supervise and regulate the financial institutions for which we provide electronic payment processing and other payment related services. The FFIEC examines large data processors in order to identify and mitigate risks associated with systemically significant service providers, including specifically the risks they may pose to the banking industry.
Privacy, Information Security and Other Business Practices Regulation
Aspects of our business are also subject, directly or indirectly, to business and trade practices regulation in the United States, the European Union and elsewhere. For example, in the United States, we and our financial institution customers are, respectively, subject to the Federal Trade Commission’s and the federal banking regulators’ privacy and information safeguarding requirements under the Gramm-Leach-Bliley Act. These requirements limit the manner in which personal information may be collected, stored, used and disclosed. The Federal Trade Commission’s information safeguarding rules require us to develop, implement and maintain a written, comprehensive information security program containing safeguards that are appropriate for our size and complexity, the nature and scope of our activities and the sensitivity of any customer information at issue. In many jurisdictions, including every U.S. State, consumers must be notified in the event of a data breach, and such notification requirements continue to increase in scope and cost. The changing privacy laws in the United States, Europe and elsewhere, including the adoption by the European Union of the General Data Protection Regulation, which became effective in May 2018, and the CCPA, which became effective in January 2020, create new individual privacy rights and impose increased obligations on companies handling personal data. In addition, multiple states, Congress and regulators outside the United States are considering similar laws or regulations which could create new individual privacy rights and impose increased obligations on companies handling personal data. See Item 1A. Risk Factors - "Any new implementation of or changes made to laws, regulations, card network rules or other industry standards affecting our business in any of the geographic regions in which we operate may require significant development efforts or have an unfavorable effect on our financial results and our cash flows."
Anti-Money Laundering and Counter Terrorist Requirements
In many countries, we are legally or contractually required to comply with the anti-money laundering laws and regulations, such as, in the United States, the Bank Secrecy Act, as amended by the USA PATRIOT Act (collectively, the "Bank Secrecy Act"), and similar laws of other countries, which require that customer identifying information be obtained and verified. In some countries, we are directly subject to these requirements; in other countries, we have contractually agreed to assist our sponsor financial institutions with their obligation to comply with anti-money laundering requirements that apply to them. In addition, we and our sponsor financial institutions are subject to the laws and regulations enforced by the Office of Foreign Assets Control ("OFAC"), which prohibit U.S. persons from engaging in transactions with certain prohibited persons or entities. Similar requirements apply in other countries. We have developed procedures and controls that are designed to monitor and address legal and regulatory requirements and developments and that allow our customers to protect against having direct business dealings with such prohibited countries, individuals or entities.
The Financial Crimes Enforcement Network of the U.S. Department of the Treasury ("FinCEN") has issued a rule regarding the applicability of the Bank Secrecy Act's anti-money laundering provisions to "prepaid access programs." This rulemaking clarifies the anti-money laundering obligations for entities, such as our Business and Consumer Solutions business and its distributors, engaged in the provision and sale of prepaid access devices like our GPR prepaid cards. Certain of our operating subsidiaries have registered with FinCEN as a money services business. This registration results in our having direct responsibility to maintain and implement an anti-money laundering compliance program.
11
State Wage Payment Laws and Regulations
The use of payroll card programs as a means for an employer to remit wages or other compensation to its employees or independent contractors is governed by state labor laws related to wage payments, which laws are subject to change. The paycard portion of our Business and Consumer Solutions segment includes payroll cards and convenience checks and is designed to allow employers to comply with applicable state wage and hour laws. Most states permit the use of payroll cards as a method of paying wages to employees, either through statutory provisions allowing such use or, in the absence of specific statutory guidance, the adoption by state labor departments of formal or informal policies allowing for their use. Nearly every state allowing payroll cards places certain requirements and/or restrictions on their use as a wage payment method, the most common of which involve obtaining the prior written consent of the employee, limitations on fees and disclosure requirements.
Escheat Laws
We are subject to unclaimed or abandoned property state laws in the United States and in certain foreign countries that require us to transfer to certain government authorities the unclaimed property of others that we hold when that property has been unclaimed for a certain period of time. Moreover, we are subject to audit by state and foreign regulatory authorities with regard to our escheatment practices.
Debt Collection and Credit Reporting Laws
Portions of our business may be subject to the Fair Debt Collection Practices Act ("FDCPA"), the Fair Credit Reporting Act ("FCRA") and similar state laws. These debt collection laws are designed to eliminate abusive, deceptive and unfair debt collection practices and may require licensing at the state level. The FCRA regulates the use and reporting of consumer credit information and also imposes disclosure requirements on entities that take adverse action based on information obtained from credit reporting agencies.
Telephone Consumer Protection Act
We are subject to the Telephone Consumer Protection Act ("TCPA") and various state laws to the extent we place telephone calls and short message service ("SMS") messages to customers and consumers. The TCPA regulates certain telephone calls and SMS messages placed using automatic telephone dialing systems or artificial or prerecorded voices.
Where to Find More Information
We file annual and quarterly reports, proxy statements and other information with the U.S. Securities and Exchange Commission ("SEC"). You may read and print materials that we have filed with the SEC from its website at www.sec.gov. In addition, certain of our SEC filings, including our annual reports on Form 10-K, our quarterly reports on Form 10-Q, our current reports on Form 8-K and amendments to them can be viewed and printed, free of charge, from the investor relations section of our website at www.globalpaymentsinc.com as soon as reasonably practicable after such material is electronically filed with or furnished to the SEC. Certain materials relating to our corporate governance, including our codes of ethics applicable to our directors, senior financial officers and other employees, are also available in the investor relations section of our website. Copies of our filings, specified exhibits and corporate governance materials are also available, free of charge, by writing us using the address on the cover of this Annual Report on Form 10-K. You may also telephone our investor relations office directly at (770) 829-8478. We are not including the information on our website as a part of, or incorporating it by reference into, this Annual Report on Form 10-K.
12
ITEM 1A - RISK FACTORS
An investment in our common stock involves a high degree of risk. You should consider carefully the following risks and other information contained in this Annual Report on Form 10-K and other SEC filings before you decide whether to buy our common stock. The risks identified below are not all encompassing but should be considered in establishing an opinion of our future operations. If any of the events contemplated by the following discussion of risks should occur, our business, results of operations, financial condition and cash flows could suffer significantly. As a result, the market price of our common stock could decline and you may lose all or part of your investment in our common stock.
Risks Related to Our Business and Operations
Our ability to protect our systems and data from continually evolving cybersecurity risks or other technological risks could affect our reputation among our customers and cardholders, adversely affect our continued card network registration or membership and financial institution sponsorship, and may expose us to penalties, fines, liabilities and legal claims.
In order to provide our services, we process and store sensitive business information and personal information, which may include credit and debit card numbers, bank account numbers, social security numbers, driver’s license numbers, names and addresses, and other types of personal information or sensitive business information. Some of this information is also processed and stored by financial institutions, merchants and other entities, as well as third-party service providers to whom we outsource certain functions and other agents, which we refer to collectively as our associated third parties. We may have responsibility to the card networks, financial institutions, and in some instances, our merchants, ISOs and/or individuals, for our failure or the failure of our associated third parties (as applicable) to protect this information.
We are a regular target of malicious third-party attempts to identify and exploit system vulnerabilities, and/or penetrate or bypass our security measures, in order to gain unauthorized access to our networks and systems or those of our associated third parties. Such access could lead to the compromise of sensitive, business, personal or confidential information. As a result, we follow a defense-in-depth model for cybersecurity, meaning we proactively seek to employ multiple methods at different layers to defend our systems against intrusion and attack and to protect the data we collect. However, we cannot be certain that these measures will be successful and will be sufficient to counter all current and emerging technology threats.
Our computer systems and/or our associated third parties’ computer systems could be subject to penetration, and our data protection measures may not prevent unauthorized access. The techniques used to obtain unauthorized access, disable or degrade service or sabotage systems change frequently and are often difficult to detect and continually evolve and become more sophisticated. Threats to our systems and our associated third parties’ systems can derive from human error, fraud or malice on the part of employees or third parties, including state-sponsored organizations with significant financial and technological resources. Computer viruses and other malware can be distributed and could infiltrate our systems or those of our associated third parties. In addition, denial of service or other attacks could be launched against us for a variety of purposes, including to interfere with our services or create a diversion for other malicious activities. Our defensive measures may not prevent downtime, unauthorized access or use of sensitive data. While we maintain first- and third-party insurance coverage that may cover certain aspects of cyber risks, such insurance coverage may be insufficient to cover all losses. Companies we acquire may require post-closing implementation of additional cyber defense methods to align with our standards and, as a result, there may be a period of increased risk between the closing of an acquisition and the completion of such implementation. Further, certain of our third-party relationships are subject to our vendor management program and governed by written contracts; however, we do not control the actions of our associated third parties, and any problems experienced by these third parties, including those resulting from breakdowns or other disruptions in the services provided by such parties or cyberattacks and security breaches, could adversely affect our ability to service our customers or otherwise conduct our business.
In addition, we cannot provide assurance that the contractual requirements related to use, security and privacy that we impose on our associated third parties who have access to this data will be followed or will be adequate to prevent the misuse of this data. Any misuse or compromise of personal information or failure to adequately enforce these contractual requirements could result in liability, protracted and costly litigation and, with respect to misuse of personal information of our customers, lost revenue and reputational harm.
Any type of security breach, attack or misuse of data described above or otherwise, whether experienced by us or an associated third party, could harm our reputation and deter existing and prospective customers from using our services or from making electronic payments generally, increase our operating expenses in order to contain and remediate the incident, expose us to unanticipated or uninsured liability, disrupt our operations (including potential service interruptions), distract our management, increase our risk of litigation or regulatory scrutiny, result in the imposition of penalties and fines under state, federal and foreign laws or by the card networks, and adversely affect our continued card network registration or membership and financial institution
13
sponsorship. Our removal from networks' lists of Payment Card Industry Data Security Standard compliant service providers could mean that existing customers, sales partners or other third parties may cease using or referring our services. Also, prospective merchant customers, financial institutions, sales partners or other third parties may choose to terminate negotiations with us, or delay or choose not to consider us for their processing needs. In addition, the card networks could refuse to allow us to process through their networks.
The payments technology industry is highly competitive, and some of our competitors are larger and have greater financial and operational resources than we do, which may give them an advantage with respect to the pricing of services offered to customers and the ability to develop new technologies.
We operate in the payments technology industry, which is highly competitive. In this industry, our primary competitors include other independent payment processors, credit card processing firms, as well as financial institutions, ISOs, prepaid programs managers and, potentially, card networks. We compete with many larger companies that have greater financial and operational resources than we have. Our competitors that are financial institutions or subsidiaries of financial institutions do not incur the costs associated with being sponsored by a direct member for participation in the card networks, as we do in certain jurisdictions, and may be able to settle transactions more quickly for merchants than we can. These financial institutions may also provide payment processing services to merchants at a loss in order to generate banking fees from the merchants. It is also possible that larger financial institutions could decide to perform in-house some or all of the services that we currently provide or could provide. These attributes may provide them with a competitive advantage in the market.
Additionally, the market for prepaid cards, demand deposit accounts and alternative financial services is similarly highly competitive and competition is increasing as more companies endeavor to address the needs of underbanked consumers. We anticipate increased competition from alternative financial services providers who are often well positioned to service the underbanked and who may wish to develop their own prepaid card or demand deposit account programs. We also face strong price competition. To stay competitive, we may have to increase the incentives that we offer to our distributors and reduce the prices of our services, which could adversely affect our financial position, operating results or cash flows.
Furthermore, we are facing increasing competition from nontraditional competitors, including new entrant technology companies who offer certain innovations in payment methods. Some of these competitors utilize proprietary software and service solutions. Some of these nontraditional competitors have significant financial resources and robust networks and are highly regarded by consumers. In addition, some nontraditional competitors, such as private companies or startup companies, may be less risk averse than we are and, therefore, may be able to respond more quickly to market demands. If these nontraditional competitors gain a greater share of total electronic payments transactions, it could have a material adverse effect on our business, financial condition, results of operations and cash flows. These competitors may compete in ways that minimize or remove the role of traditional card networks, acquirers, issuers and processors in the electronic payments process.
In order to remain competitive and to continue to increase our revenues and earnings, we must continually and quickly update our services, a process that could result in higher costs and the loss of revenues, earnings and customers if the new services do not perform as intended or are not accepted in the marketplace.
The payments technology industry in which we compete is characterized by rapid technological change, new product introductions, evolving industry standards and changing customer needs. In order to remain competitive, we are continually involved in a number of projects, including the development of a new authorization platform, mobile payment applications, ecommerce services and other new offerings emerging in the payments technology industry. These projects carry the risks associated with any development effort, including cost overruns, delays in delivery and performance problems. In the payments technology markets, these risks are even more acute. Any delay in the delivery of new services or the failure to differentiate our services could render our services less desirable to customers, or possibly even obsolete. Furthermore, as the market for alternative payment processing services evolves, it may develop too rapidly or not rapidly enough for us to recover the costs we have incurred in developing new services targeted at this market.
In addition, certain of the services we deliver to the payments technology markets are designed to process very complex transactions and deliver reports and other information on those transactions, all at very high volumes and processing speeds. Any failure to deliver an effective and secure product or any performance issue that arises with a new product or service could result in significant processing or reporting errors or other losses. As a result of these factors, our development efforts could result in higher costs that could reduce our earnings in addition to a loss of revenues and earnings if promised new services are not delivered timely to our customers or do not perform as anticipated. We rely in part on third parties, including some of our competitors and potential competitors, for the development of and access to new technologies.
14
Our revenues from the sale of services to merchants that accept Visa cards and Mastercard cards are dependent upon our continued Visa and Mastercard registrations, financial institution sponsorship and, in some cases, continued membership in certain card networks.
In order to provide our Visa and Mastercard transaction processing services, we must be either a direct member or be registered as a merchant processor or service provider of Visa and Mastercard, respectively. Registration as a merchant processor or service provider is dependent upon our being sponsored by Members of each organization in certain jurisdictions. If our sponsor financial institution in any market should stop providing sponsorship for us, we would need to find another financial institution to provide those services or we would need to attain direct membership with the card networks, either of which could prove to be difficult and expensive. If we are unable to find a replacement financial institution to provide sponsorship or attain direct membership, we may no longer be able to provide processing services to affected customers and potential customers in that market, which would negatively affect our revenues, earnings and cash flows. Furthermore, some agreements with our financial institution sponsors give them substantial discretion in approving certain aspects of our business practices, including our solicitation, application and qualification procedures for merchants and the terms of our agreements with merchants. Our sponsors' discretionary actions under these agreements could have a material adverse effect on our business, financial condition, results of operations and cash flows. In connection with direct membership, the rules and regulations of various card associations and networks prescribe certain capital requirements. Any increase in the capital level required would limit our use of capital for other purposes.
The termination of our registration, or any changes in the Visa or Mastercard rules that would impair our registration, could require us to stop providing Visa and Mastercard payment processing services, which would make it impossible for us to conduct our business on its current scale. The rules of the card networks are set by their boards, which may be influenced by card issuers, and some of those issuers also provide acquiring services and are our competitors or our customers in both the Merchant Solutions and Issuer Solutions segments. If we fail to comply with the applicable requirements of the card networks, the card networks could seek to fine us, suspend us or terminate our registrations or membership. The termination of our registrations or our membership or our status as a service provider or a merchant processor, or any changes in card association or other network rules or standards, including interpretation and implementation of the rules or standards, that increase the cost of doing business or limit our ability to provide transaction processing services to our customers, could have a material adverse effect on our business, financial condition, results of operations and cash flows. If a merchant or an ISO fails to comply with the applicable requirements of the card associations and networks, we or the merchant or ISO could be subject to a variety of fines or penalties that may be levied by the card associations or networks. If we cannot collect or pursue collection of such amounts from the applicable merchant or ISO, we may have to bear the cost of such fines or penalties, resulting in lower earnings for us.
Our Business and Consumer Solutions segment relies on certain relationships with issuing banks, distributors, marketers and brand partners. The loss of such relationships, or if we are unable to maintain such relationships on terms that are favorable to us, may materially adversely affect our business, financial position, operating results or cash flows.
Our Business and Consumer Solutions segment relies on arrangements that we have with issuing banks to provide us with critical products and services, including the FDIC-insured depository accounts tied to the cards and accounts we manage, access to the ATM networks, membership in the card associations and network organizations and other banking services. The majority of our active Business and Consumer Solutions cards and accounts are issued or opened through Meta Payment Systems ("MetaBank"). If any material adverse event were to affect MetaBank's or another of our critical issuing banks, or we were to lose MetaBank or another critical bank, or MetaBank or another critical bank grew to a size such that it was no longer able to avail itself of certain regulatory exemptions for small banks, we would be forced to find an alternative provider for these critical banking services. It may not be possible to find a replacement bank on terms that are acceptable to us or at all. Any change in the issuing banks could disrupt the business or result in arrangements with new banks that are less favorable to us than those we have with our existing issuing banks, either of which could have a material adverse impact on our business, financial position, operating results or cash flows.
Furthermore, our Business and Consumer Solutions segment depends in large part on establishing agreements with distributors, marketers and brand partners, primarily alternative financial services providers, as well as grocery and convenience stores and other traditional retailers. Some of these companies may endeavor to internally develop their own programs or enter into exclusive relationships with our competitors to distribute or market their products. The loss of, or a substantial decrease in revenues from, one or more of our top distributors, marketers or brand partners could have a material adverse effect on our business, financial position, operating results or cash flows.
15
We rely on various financial institutions to provide clearing services in connection with our settlement activities. If we are unable to maintain clearing services with these financial institutions and are unable to find a replacement, our business may be adversely affected.
We rely on various financial institutions to provide clearing services in connection with our settlement activities. If such financial institutions should stop providing clearing services, we must find other financial institutions to provide those services. If we are unable to find a replacement financial institution we may no longer be able to provide processing services to certain customers, which could negatively affect our financial position, results of operations or cash flows.
Our systems or our third-party providers' systems may fail, which could interrupt our service, cause us to lose business, increase our costs and expose us to liability.
We depend on the efficient and uninterrupted operation of our computer systems, software, data centers and telecommunications networks, as well as the systems and services of third parties. A system outage or data loss could have a material adverse effect on our business, financial condition, results of operations and cash flows. Not only would we suffer damage to our reputation in the event of a system outage or data loss, but we may also be liable to third parties. Many of our contractual agreements with financial institutions require the payment of penalties if we do not meet certain operating standards. Our systems and operations or those of our third-party providers could be exposed to damage or interruption from, among other things, fire, natural disaster, power loss, telecommunications failure, terrorist acts, war, unauthorized entry, human error, and computer viruses or other defects. Defects in our systems or those of third parties, errors or delays in the processing of payment transactions, telecommunications failures, or other difficulties (including those related to system relocation) could result in loss of revenues, loss of customers, loss of merchant and cardholder data, harm to our business or reputation, exposure to fraud losses or other liabilities, negative publicity, additional operating and development costs, fines and other sanctions imposed by card networks, and/or diversion of technical and other resources.
We may experience software defects, undetected errors, and development delays, which could damage customer relations, decrease our potential profitability and expose us to liability.
Our services are based on software and computing systems that often encounter development delays, and the underlying software may contain undetected errors, viruses or defects. Defects in our software services and errors or delays in our processing of electronic transactions could result in additional development costs, diversion of technical and other resources from our other development efforts, loss of credibility with current or potential customers, harm to our reputation and exposure to liability claims.
In addition, we rely on technologies and software supplied by third parties that may also contain undetected errors, viruses or defects that could have a material adverse effect on our business, financial condition, results of operations or cash flows.
Increased merchant, referral partner or ISO attrition could cause our financial results to decline.
We experience attrition in merchant credit and debit card processing volume resulting from several factors, including business closures, transfers of merchants' accounts to our competitors, unsuccessful contract renewal negotiations and account closures that we initiate for various reasons, such as heightened credit risks or contract breaches by merchants. If an ISO partner switches to another transaction processor, terminates our services, internalizes payment processing functions that we perform, merges with or is acquired by one of our competitors, or shuts down or becomes insolvent, we may no longer receive new merchant referrals from the ISO, and we risk losing existing merchants that were originally enrolled by the ISO. We cannot predict the level of attrition in the future and it could increase. Our referral partners are a significant source of new business. Higher than expected attrition could negatively affect our results, which could have a material adverse effect on our business, financial condition, results of operations or cash flows.
Our future growth depends in part on the continued expansion within markets in which we already operate, the emergence of new markets, and the continued availability of alliance relationships and strategic acquisition opportunities.
Our future growth and profitability depend upon our continued expansion within the markets in which we currently operate, the further expansion of these markets, the emergence of other markets for payment technology and software solutions and our ability to penetrate these markets. As part of our strategy to achieve this expansion, we look for acquisition opportunities, investments and alliance relationships with other businesses that will allow us to increase our market penetration, technological capabilities, product offerings and distribution capabilities. We may not be able to successfully identify suitable acquisition, investment and alliance candidates in the future, and if we do, they may not provide us with the value and benefits we anticipate.
16
Our expansion into new markets is also dependent upon our ability to apply our existing technology or to develop new applications to meet the particular service needs of each new market. We may not have adequate financial or technological resources to develop effective and secure services and distribution channels that will satisfy the demands of these new markets. If we fail to expand into new and existing markets for payment technology and software solutions, we may not be able to continue to grow our revenues and earnings.
There may be a decline in the use of cards and other electronic payments as a payment mechanism for consumers or other adverse developments with respect to the card industry in general.
If consumers do not continue to use credit, debit or GPR prepaid debit cards or other electronic payment methods of the type we process as a payment mechanism for their transactions or if there is a change in the mix of payments between cash, checks, credit cards and debit or GPR prepaid debit cards, which is adverse to us, it could have a material adverse effect on our business, financial condition, results of operations and cash flows. Consumer credit risk may make it more difficult or expensive for consumers to gain access to credit facilities such as credit cards. Regulatory changes may result in financial institutions seeking to charge their customers additional fees for use of credit or debit cards. Such fees may result in decreased use of credit or debit cards by cardholders. In each case, our business, financial condition, results of operations and cash flows may be adversely affected. We believe future growth in the use of credit, debit and GPR prepaid debit cards and other electronic payments will be driven by the cost, ease-of-use, and quality of services offered to consumers and businesses. In order to consistently increase and maintain our profitability, consumers and businesses must continue to use electronic payment methods that we process, including credit, debit and GPR prepaid debit cards.
Consolidation among financial institutions or among retail customers, including the merger of our customers with entities that are not our customers or the sale of portfolios by our customers to entities that are not our customers could materially affect our financial position, results of operation or cash flows.
Our Issuer Solutions segment has many long-term customer contracts with card issuers. Consolidation among financial institutions, particularly in the area of credit card operations, and consolidation in the retail industry, is a risk that could negatively affect our existing agreements and future revenues with these customers. In addition, consolidation among financial institutions has led to an increasingly concentrated customer base, which results in a changing customer mix toward larger customers. Continued consolidation among financial institutions could increase the bargaining power of our current and future customers and further increase our customer concentration. Consolidation among financial institutions and retail customers and the resulting loss of any significant customer by us could have a material adverse effect on our financial position, results of operations or cash flows.
If we do not renew or renegotiate our agreements on favorable terms with our customers within the Issuer Solutions segment, our business will suffer.
A significant amount of our Issuer Solutions segment revenues is derived from long-term contracts with large customers. The financial position of these customers and their willingness to pay for our products and services are affected by general market positions, competitive pressures and operating margins within their industries. When our long-term contracts expire, the time of renewal or renegotiation presents our customers with the opportunity to consider other providers, transition all or a portion of the services we provide in-house or seek lower rates for our services. The loss of our contracts with existing customers or renegotiation of contracts at reduced rates or reduced service levels could have a material adverse effect on our financial position, results of operation or cash flows.
In addition, the timing of the conversion of card portfolios of new payment processing customers to our processing systems and the deconversion of existing customers to other systems impacts our revenues and expenses. Due to a variety of factors, conversions and deconversions may not occur as scheduled and this may have a material adverse effect on our financial position and results of operations.
We incur chargeback losses when our merchants refuse or cannot reimburse us for chargebacks resolved in favor of their customers. Any increase in chargebacks not paid by our merchants may adversely affect our business, financial condition, results of operations and cash flows.
In the event a dispute between a cardholder and a merchant is not resolved in favor of the merchant, the transaction is normally charged back to the merchant and the purchase price is credited or otherwise refunded to the cardholder. If we are unable to collect such amounts from the merchant's account or reserve account (if applicable), or if the merchant refuses or is unable, due to closure, bankruptcy or other reasons, to reimburse us for a chargeback, we bear the loss for the amount of the refund paid to the cardholder. The risk of chargebacks is typically greater with those merchants that promise future delivery of goods and services rather than
17
delivering goods or rendering services at the time of payment. We may experience significant losses from chargebacks in the future. Any increase in chargebacks not paid by our merchants could have a material adverse effect on our business, financial condition, results of operations and cash flows. We have policies to manage merchant-related credit risk and often mitigate such risk by requiring collateral and monitoring transaction activity. Notwithstanding our programs and policies for managing credit risk, it is possible that a default on such obligations by one or more of our merchants could have a material adverse effect on our business.
Fraud by merchants, prepaid cardholders or others and losses from overdrawn cardholder accounts could have an adverse effect on our financial condition, results of operations and cash flows.
We have potential liability for fraudulent electronic payment transactions or credits initiated by merchants or others, and our prepaid card programs expose us to threats involving the misuse of cards, collusion, fraud and identity theft. Criminals are using increasingly sophisticated methods to engage in illegal activities such as counterfeiting and fraud. Failure to effectively manage risk and prevent fraud could increase our chargeback losses or cause us to incur other liabilities. It is possible that incidents of fraud could increase in the future. Increases in chargebacks or other liabilities could have a material adverse effect on our financial condition, results of operations and cash flows.
We are subject to economic and geopolitical risk, the business cycles and credit risk of our customers and the overall level of consumer, business and government spending, which could negatively affect our business, financial condition, results of operations and cash flows.
The global payments technology industry depends heavily on the overall level of consumer, business and government spending. We are exposed to general economic conditions that affect consumer confidence, consumer spending, consumer discretionary income and changes in consumer purchasing habits. A sustained deterioration in general economic conditions in the markets in which we operate or increases in interest rates may adversely affect our financial performance by reducing the number or average purchase amount of transactions made using electronic payments. A reduction in the amount of consumer spending could result in a decrease in our revenues and profits. If our merchants make fewer sales to consumers using electronic payments or consumers using electronic payments spend less per transaction, we will have fewer transactions to process or lower transaction amounts, each of which would contribute to lower revenues. Additionally, credit card issuers may reduce credit limits and become more selective in their card issuance practices. Any of these developments could have a material adverse impact on our financial position and results of operations.
A downturn in the economy could force retailers to close or file bankruptcy, resulting in lower revenue and earnings for us and greater exposure to potential credit losses and future transaction declines. We also have a certain amount of fixed and other costs, including rent, debt service, and salaries, which could limit our ability to quickly adjust costs and respond to changes in our business and the economy. Changes in economic conditions could also adversely affect our future revenues and profits and cause a materially adverse effect on our business, financial condition, results of operations or cash flows.
Reject losses arise from the fact that, in most markets, we collect our fees from our merchants on the first day after the monthly billing period. This results in the build-up of a substantial receivable from our customers. If a merchant has gone out of business during the billing period, we may be unable to collect such fees, which could negatively affect our business, financial condition, results of operations or cash flows.
In addition, our business, growth, financial condition or results of operations could be materially adversely affected by instability or changes in a country’s or region’s economic conditions; inflation; changes in laws or regulations or in the interpretation of existing laws or regulations, whether caused by a change in government or otherwise; increased difficulty of conducting business in a country or region due to actual or potential political or military conflict; or action by the United States or foreign governments that may restrict our ability to transact business in a foreign country or with certain foreign individuals or entities, such as sanctions by or against the Russian Federation. A possible slowdown in global trade caused by increasing tariffs or other restrictions could decrease consumer or corporate confidence and reduce consumer, government and corporate spending in countries inside or outside the United States, which could adversely affect our operations.
The referendum in the United Kingdom in favor of the United Kingdom leaving the European Union, commonly referred to as "Brexit," has caused, and may continue to cause, economic uncertainty, including volatility in global stock markets and currency exchange fluctuations, which may adversely affect the profitability of our U.K. operations. In addition, Brexit could lead to increased regulatory complexities, including, without limitation, regulation relating to data security, privacy and taxation. On January 31, 2020, the United Kingdom ceased to be a member state of the European Union. As a result of its exit from the E.U., the U.K. lost access to the E.U. single market and to E.U. trade deals negotiated with other jurisdictions at that time, so the long-term effects of Brexit will depend on the agreements or arrangements with the European Union for the United Kingdom to retain
18
access to E.U. markets either during a transitional period or more permanently. Consequently, no assurance can be given about the effect of the outcome on our U.K. business and its financial conditions, results of operations and cash flows may be adversely affected.
Increases in card network fees may result in the loss of customers and/or a reduction in our earnings.
From time-to-time, the card networks, including Visa and Mastercard, increase the fees that they charge processors. We could attempt to pass these increases along to our merchant customers, but this strategy might result in the loss of customers to our competitors who may not pass along the increases, thereby reducing our revenues and earnings. If competitive practices prevent us from passing along the higher fees to our merchant customers in the future, we may have to absorb all or a portion of such increases, thereby increase our operating costs and reducing our earnings.
Any new implementation of or changes made to laws, regulations or other industry standards affecting our business in any of the geographic regions in which we operate may require significant development efforts or have an unfavorable effect on our financial results and our cash flows.
Our business is affected by laws and regulations and examinations that affect us and our industry in the countries in which we operate. Regulation and proposed regulation of the payments industry has increased significantly in recent years. Failure to comply with regulations or guidelines may result in the suspension or revocation of a license or registration, the limitation, suspension or termination of service, and the imposition of civil and criminal penalties, including fines, or may cause customers or potential customers to be reluctant to do business with us, any of which could have an adverse effect on our financial condition. For example, we are subject to applicable privacy and information security regulations in the regions where we operate; the Payment Services Directive in Europe; The Code of Conduct for the Credit and Debit Card Industry in Canada (issued by Canada's Department of Finance); the Housing Assistance Tax Act of 2008 in the United States; HIPAA and other health privacy regulations and a myriad of U.S. federal and state consumer protection laws and state escheat regulations. In addition, the U.K. Payment Systems Regulator is conducting a market review of the card acquiring industry. We are also subject to examination by the FFIEC as a result of our provision of data processing services to financial institutions.
Interchange fees are subject to intense legal, regulatory and legislative scrutiny worldwide. For instance, the Dodd-Frank Act restricts the amounts of debit card fees that certain issuing institutions can charge merchants and allowing merchants to set minimum amounts for the acceptance of credit cards and to offer discounts for different payment methods. These types of restrictions could negatively affect the number of debit transactions, which would adversely affect our business. The Dodd-Frank Act also created the CFPB, which has assumed responsibility for enforcing federal consumer protection laws, and the Financial Stability Oversight Council, which has the authority to determine whether any nonbank financial company, such as us, should be supervised by the Board of Governors of the Federal Reserve on the ground that it is "systemically important" to the U.S. financial system. Any such designation would result in increased regulatory burdens on our business, which increases our risk profile and may have an adverse effect on our business, financial condition, results of operations and cash flows.
All persons offering or providing financial services or products to consumers, directly or indirectly, can be subject to prohibitions against unfair, deceptive, or abusive acts or practices under the Dodd-Frank Act. More generally, all persons engaged in commerce, including, but not limited to, us and our merchant and financial institution customers, are also subject to Section 5 of the Federal Trade Commission ("FTC") Act prohibiting unfair or deceptive acts or practices ("UDAP"). In addition, there are other laws, rules and or regulations, including the Telemarketing Sales Act, that may directly impact us or the activities of our merchant customers and in some cases may subject us to investigations, fees, fines and disgorgement of funds in the event we are deemed to have aided and abetted or otherwise provided the means and instrumentalities to facilitate the illegal activities of the merchant through our payment processing services. Various federal and state regulatory enforcement agencies, including the FTC, the CFPB and the states’ attorneys general have the authority to take action against nonbanks that engage in UDAP or violate other laws, rules or regulations and, to the extent we are processing payments for a merchant that may be in violation of these laws, rules or regulations, we may be subject to enforcement actions and as a result may incur losses and liabilities.
In many countries, we are legally or contractually required to comply with the anti-money laundering laws and regulations, such as, in the United States, the Bank Secrecy Act and similar laws of other countries, which require that customer identifying information be obtained and verified. In some countries, we are directly subject to these requirements; in other countries, we have contractually agreed to assist our financial institution customers with their obligation to comply with anti-money laundering requirements that apply to them. In addition, we and our sponsor financial institutions are subject to the laws and regulations enforced by OFAC, which prohibit U.S. persons from engaging in transactions with certain prohibited persons or entities. Similar requirements apply in other countries. Our failure to comply with any of these contractual requirements or laws could adversely affect our business, financial credit results of operations and cash flows.
19
We are also subject to a variety of foreign and domestic laws, and their implementing regulations, which establish requirements for the collection, processing, storage, use and disclosure of personal information, require notice to individuals of privacy practices, and provide individuals with certain rights to prevent use and disclosure of protected information. Regulatory authorities around the world are considering or have enacted a number of legislative and regulatory proposals concerning data privacy and use, including the E.U. General Data Protection Regulation and the California Consumer Protection Act, and the interpretation and application of consumer and data protection laws is increasingly uncertain. It is possible that these laws may be interpreted and applied in a manner that is inconsistent with our data privacy practices or operations model, which could result in potential liability for fines, damages or a need to incur substantial costs to modify our operations. Compliance with these laws and regulations can be costly and time consuming, adding a layer of complexity to business practices and innovation. As with other regulatory schemes, our failure to comply could result in public or private enforcement action and accompanying litigation costs, losses, fines and penalties.
Portions of our business may be subject to the FDCPA, the FCRA and similar state laws. These debt collection laws are designed to eliminate abusive, deceptive and unfair debt collection practices and may require licensing at the state level. If we fail to comply with any of these laws, to the extent they are applicable to us, we may be subject to fines, penalties and litigation.
With respect to our Business and Consumer Solutions segment, because each distributor offers prepaid cards, reload services and/or money remittance services as an agent of Business and Consumer Solutions, or another third party, we do not believe that the distributors themselves are required to become licensed as money transmitters in order to engage in such activity. However, there is a risk that a federal or state regulator will take a contrary position and initiate enforcement or other proceedings against a distributor, us, our issuing banks or our other service providers. If we are unsuccessful in making a persuasive argument that a distributor should not be subject to such licensing requirements and it is therefore deemed to be in violation of one or more of the state money transmitter statutes, it could result in the imposition of fines, the suspension of the distributor’s ability to offer some or all of our products and related services in the relevant jurisdiction, civil liability and criminal liability, each of which could negatively impact our financial position and results of operations. Furthermore, if the federal government or one or more state governments impose additional legislative or regulatory requirements on our Business and Consumer Solutions segment, the issuing banks or the distributors, or prohibit or limit the activities of our Business and Consumer Solutions segment as currently conducted, we may be required to modify or terminate some or all of our Business and Consumer Solutions products and services offered in the relevant jurisdiction or certain of the issuing banks may terminate their relationship with us. Moreover, as a number of our Business and Consumer Solutions distributors are engaged in offering payday, title and/or installment loans, current and future legislative and regulatory restrictions that negatively impact their ability to continue their operations could have a corresponding negative impact on our revenue and earnings from these relationships, potentially resulting in a significant decline in revenue from the Business and Consumer Solutions segment.
Changes to legal rules and regulations, or interpretation or enforcement thereof, even if not directed at us, may require significant efforts to change our systems and services and may require changes to how we price our services to customers, adversely affecting our business. Even an inadvertent failure to comply with laws and regulations, as well as rapidly evolving social expectations of corporate fairness, could damage our business or our reputation. Furthermore, we are subject to tax laws in each jurisdiction where we conduct business. Changes in such laws or their interpretations could decrease the value of revenues we receive, the value of tax losses and tax credit carry forwards recorded on our balance sheet and have a material adverse effect on our financial condition, results of operations and cash flows.
We are subject to risks associated with changes in interest rates or currency exchange rates, which could adversely affect our business, financial position, results of operations and cash flows, and we may not effectively hedge against these risks.
A portion of our current indebtedness bears interest at a variable rate, and we may incur additional variable-rate indebtedness in the future. Increases in interest rates will reduce our operating cash flows and could hinder our ability to fund our operations, capital expenditures, acquisitions, share repurchases or dividends.
We are also subject to risks related to the changes in currency exchange rates as a result of our investments in foreign operations and from revenues generated in currencies other than the U.S. dollar. Revenues and profit generated by international operations will increase or decrease compared to prior periods as a result of changes in currency exchange rates. Volatility in currency exchange rates has affected and may continue to affect our financial results.
In certain of the jurisdictions in which we operate, we may become subject to exchange control regulations that might restrict or prohibit the conversion of our foreign currencies into U.S. dollars or limit our ability to freely move currency in or out of particular jurisdictions. The occurrence of any of these factors could decrease the value of revenues we receive from our international operations and have a material adverse effect on our business.
20
We may seek to reduce our exposure to fluctuations in interest rates or currency exchange rates through the use of hedging arrangements. To the extent that we hedge our interest rate or currency exchange rate exposures, we forgo the benefits we would otherwise experience if interest rates or currency exchange rates were to change in our favor. Developing an effective strategy for dealing with movements in interest rates and currency exchange rates is complex, and no strategy can completely insulate us from risks associated with such fluctuations. In addition, a counterparty to the arrangement could default on its obligation, thereby exposing us to credit risk. We may have to repay certain costs, such as transaction fees or breakage costs, if we terminate these arrangements.
A downgrade in the ratings of our debt could restrict our ability to access the debt capital markets and increase our interest costs.
In connection with the Merger, we achieved an investment grade debt structure. Unfavorable changes in the ratings that rating agencies assign to our debt may ultimately negatively affect our access to the debt capital markets and increase the costs we incur to borrow funds. If ratings for our debt fall below investment grade, our access to the capital markets could become restricted. Future tightening in the credit markets and a reduced level of liquidity in many financial markets due to turmoil in the financial and banking industries could affect our access to the debt capital markets or the price we pay to issue debt. Additionally, our credit facilities include an increase in interest rates if the ratings for our debt are downgraded.
Changes in the method for determining the London Interbank Offered Rate ("LIBOR") and the potential replacement of the LIBOR benchmark interest rate could adversely affect our business, financial condition, results of operations and cash flows.
A portion of our current indebtedness bears interest at a variable rate based on LIBOR, and we may incur additional variable indebtedness based on LIBOR. Furthermore, we have entered into hedging instruments to manage our exposure to fluctuations in the LIBOR benchmark interest rate. In July 2017, the United Kingdom’s Financial Conduct Authority ("FCA"), a regulator of financial services firms and financial markets in the United Kingdom, stated that they will plan for a phase out of regulatory oversight of LIBOR interest rates indices. The FCA has indicated they will support the LIBOR indices through 2021, to allow for an orderly transition to an alternative reference rate. The Alternative Reference Rates Committee has proposed the Secured Overnight Financing Rate ("SOFR") as its recommended alternative to LIBOR, and the Federal Reserve Bank of New York began publishing SOFR rates in April 2018. SOFR is intended to be a broad measure of the cost of borrowing cash overnight collateralized by U.S. Treasury securities.
We are evaluating the potential effect of the eventual replacement of the LIBOR benchmark interest rate, including the possibility of SOFR as the dominant replacement. The market transition away from LIBOR and towards SOFR is expected to be gradual and complicated, including the development of term and credit adjustments to accommodate differences between LIBOR and SOFR. Introduction of an alternative rate also may introduce additional basis risk for market participants as an alternative index is utilized along with LIBOR. There can be no guarantee that SOFR will become widely used and that alternatives may or may not be developed with additional complications. We are not able to predict whether LIBOR will cease to be available after 2021, whether SOFR will become a widely accepted benchmark in place of LIBOR, or what the effect of such a possible transition to SOFR may be on our business, financial condition, results of operations or cash flows.
The integration and conversion of our acquired operations or other future acquisitions, if any, could result in increased operating costs if the anticipated synergies of operating these businesses as one are not achieved, a loss of strategic opportunities if management is distracted by the integration process, and a loss of customers if our service levels drop during or following the integration process.
The acquisition, integration, and conversion of businesses and the formation or operation of alliances, such as joint ventures and other partnering arrangements involve a number of risks. Core risks are in the area of valuation (negotiating a fair price for the business based on inherently limited diligence) and integration and conversion (managing the complex process of integrating the acquired company's people, services, information security and technology and other assets to realize the projected value of the acquired company and the synergies projected to be realized in connection with the acquisition). In addition, international acquisitions and alliances often involve additional or increased risks including, for example: managing geographically separated organizations, systems, and facilities; integrating personnel with diverse business backgrounds and organizational cultures; complying with foreign regulatory requirements; fluctuations in currency exchange rates; enforcement of intellectual property rights in some foreign countries; difficulty entering new foreign markets due to, among other things, customer acceptance and business knowledge of those new markets; and general economic and political conditions.
If the integration and conversion process does not proceed smoothly, the following factors, among others, could reduce our revenues and earnings, increase our operating costs, and result in us not achieving projected synergies:
21
• | If we are unable to successfully integrate the benefits plans, duties and responsibilities, and other factors of interest to the management and employees of the acquired business, we could lose employees to our competitors in the region, which could significantly affect our ability to operate the business and complete the integration; |
• | If the integration process causes any delays with the delivery of our services, or the quality of those services, we could lose customers to our competitors; |
• | The acquisition may otherwise cause disruption to the acquired company’s business and operations and relationships with financial institution sponsors, customers, merchants, employees and other partners; |
• | The acquisition and the related integration could divert the attention of our management from other strategic matters including possible acquisitions and alliances and planning for new product development or expansion into new markets for payments technology and software solutions; and |
• | The costs related to the integration of the acquired company’s business and operations into ours may be greater than anticipated. |
The costs and effects of pending and future litigation, investigations or similar matters, or adverse facts and developments related thereto, could materially affect our business, financial position, results of operations and cash flows.
We are from time-to-time involved in various litigation matters and governmental or regulatory investigations or similar matters arising out of our current or future business. Our insurance or indemnities may not cover all claims that may be asserted against us, and any claims asserted against us, regardless of merit or eventual outcome, may harm our reputation. Furthermore, there is no guarantee that we will be successful in defending ourselves in pending or future litigation or similar matters under various laws. Should the ultimate judgments or settlements in any pending litigation or future litigation or investigation significantly exceed our insurance coverage, they could have a material adverse effect on our business, financial condition, results of operations and cash flows.
We may not be able to successfully manage our intellectual property and may be subject to infringement claims.
In our rapidly developing legal framework, we rely on a combination of contractual rights and copyright, trademark, patent and trade secret laws to establish and protect our proprietary technology. Despite our efforts to protect our intellectual property, third parties may infringe or misappropriate our intellectual property or may develop software or technology that competes with ours. Our competitors may independently develop similar technology, duplicate our services or design around our intellectual property rights. We may have to litigate to enforce and protect our intellectual property rights, trade secrets and know-how or to determine their scope, validity or enforceability, which is expensive and could cause a diversion of resources and may not prove to be successful. The loss of intellectual property protection or the inability to secure or enforce intellectual property protection could harm our business and ability to compete.
We may also be subject to costly litigation in the event our services and technology infringe upon another party’s proprietary rights. Third parties may have, or may eventually be issued, patents that would be infringed by our services or technology. Any of these third parties could make a claim of infringement against us with respect to our services or technology. We may also be subject to claims by third parties for breach of copyright, trademark or license usage rights. Any such claims and any resulting litigation could subject us to significant liability for damages. An adverse determination in any litigation of this type could limit our ability to use the intellectual property subject to these claims and require us to design around a third party’s patent, which may not be possible, or to license alternative technology from another party, which may be costly. In addition, litigation is often time consuming and expensive to defend and could result in the diversion of the time and attention of our employees.
New or revised tax regulations, unfavorable resolution of tax contingencies or changes to enacted tax rates could adversely affect our tax expense.
Changes in tax laws or their interpretations could result in changes to enacted tax rates and may require complex computations to be performed that were not previously required, significant judgments to be made in interpretation of the new or revised tax regulations and significant estimates in calculations, as well as the preparation and analysis of information not previously relevant or regularly produced. Future changes in enacted tax rates could negatively affect our results of operations.
Our tax returns and positions are subject to review and audit by federal, state, local and international taxing authorities. An unfavorable outcome to a tax audit could result in higher tax expense, thereby negatively affecting our results of operations and cash flows. We have recognized estimated liabilities on the balance sheet for material known tax exposures relating to deductions, transactions and other matters involving some uncertainty as to the proper tax treatment of the item. These liabilities reflect what we believe to be reasonable assumptions as to the likely final resolution of each issue if raised by a taxing authority. While we believe that the liabilities are adequate to cover reasonably expected tax risks, there can be no assurance that, in all instances, an
22
issue raised by a tax authority will be finally resolved at a financial amount no more than any related liability. An unfavorable resolution, therefore, could negatively affect our financial position, results of operations and cash flows in the current and/or future periods.
We may become subject to additional U.S., state or foreign taxes that cannot be passed through to our customers, in which case our earnings and cash flows could be adversely affected.
We are or may be subject in various jurisdictions to certain taxes that are not derived based on earnings (e.g. sales, gross receipts, property, value-added and other business taxes). Application of these taxes is an emerging issue in our industry and the taxing authorities have not yet all adopted uniform regulations on certain of these topics. If we are required to pay such taxes and are not able to pass the tax cost through to our customers, our earnings and cash flows would be negatively affected.
We have structured our business in accordance with existing tax laws and interpretations of such laws which have been confirmed through either tax rulings or opinions obtained in various jurisdictions, including those related to value-added taxes in Europe. Changes in tax laws or their interpretations could decrease the value of revenues we receive and the amount of our cash flows and have a material adverse effect on our business.
Risks Related to the Merger with TSYS
We have incurred and expect to continue to incur substantial costs in connection with integration activities related to the Merger.
We have incurred and expect to continue to incur substantial costs and charges in connection with integration activities related to the Merger, including costs associated with employee termination benefits, consulting and other advisory fees, as well as asset write-offs. There are a large number of processes, policies, procedures, operations, technologies and systems that may need to be integrated, including our business operating platforms and other operational matters as well as integrating our purchasing, accounting and finance, sales, payroll, pricing and benefits and other administrative processes. While we have assumed that a certain level of costs will be incurred, there are many factors beyond our control that could affect the total amount or the timing of the integration costs. Moreover, many of the costs that will continue to be incurred are, by their nature, difficult to estimate accurately. These costs could, particularly in the near term, exceed the savings that we expect to achieve from the elimination of duplicative costs and the realization of economies of scale and cost savings. These integration costs may result in significant charges against earnings, and the amount and timing of such charges are uncertain at present.
Combining with TSYS may be more difficult, costly or time consuming than expected and we may fail to realize the anticipated benefits of the Merger.
The success of the Merger will depend, in part, on the ability to realize the anticipated cost savings from combining our business with the acquired operations of TSYS. To realize the anticipated benefits and cost savings from the Merger, we must successfully integrate and combine our businesses in a manner that permits those cost savings to be realized. If we are not able to successfully achieve these objectives, the anticipated benefits of the Merger may not be realized fully or at all or may take longer to realize than expected. In addition, the actual cost savings and anticipated benefits of the Merger could be less than anticipated.
It is possible that the integration process could result in the loss of key employees, the disruption of our ongoing business or inconsistencies in standards, controls, procedures and policies that adversely affect our ability to maintain relationships with customers, commercial counterparties and employees or to achieve the anticipated benefits and cost savings of the Merger. Integration efforts may also divert management attention and resources. These integration matters could have an adverse effect on us for an undetermined period.
Our future results may suffer if we do not effectively manage our expanded operations.
Following the completion of the Merger, the size of our business increased significantly. Our future success will depend, in part, upon our ability to manage this expanded business, which will pose substantial challenges for management, including challenges related to the management and monitoring of new operations and associated increased costs and complexity. We may also face increased scrutiny from governmental authorities as a result of the significant increase in the size of our business. There can be no assurances that we will be successful or that we will realize the expected operating efficiencies, cost savings, revenue enhancements or other benefits currently anticipated from the Merger.
23
Risks Related to Our Organizational and Capital Structure
If we lose key personnel or are unable to attract additional qualified personnel as we grow, our business could be adversely affected.
All of our businesses function at the intersection of rapidly changing technological, social, economic and regulatory developments that requires a wide ranging set of expertise and intellectual capital. To successfully compete and grow, we must recruit, develop and retain the necessary personnel who can provide the needed expertise across the entire spectrum of intellectual capital needs. In addition, we must develop our personnel to fulfill succession plans capable of maintaining continuity in the midst of the inevitable unpredictability of human capital. However, the market for qualified personnel is competitive, and we may not succeed in recruiting additional personnel or may fail to effectively replace current personnel who depart with qualified or effective successors. In addition, the success of the Merger will depend in part on our ability to retain key employees. It is possible that these employees may decide not to remain with us. We cannot assure that key personnel, including executive officers, will continue to be employed or that we will be able to attract and retain qualified personnel in the future. Failure to retain or attract key personnel could have a material adverse effect on our business, financial condition, results of operations and cash flows.
Our substantial indebtedness could adversely affect us and limit our business flexibility.
We have a significant amount of indebtedness. Our level of debt and the covenants to which we agreed could have negative consequences on us, including, among other things, (1) requiring us to dedicate a large portion of our cash flow from operations to servicing and repayment of the debt; (2) limiting funds available for strategic initiatives and opportunities, working capital and other general corporate needs and (3) limiting our ability to incur certain kinds or amounts of additional indebtedness, which could restrict our flexibility to react to changes in our business, our industry and economic conditions.
We may not be able to raise additional funds to finance our future capital needs.
We may need to raise additional funds to finance our future capital needs, including developing new products and technologies or to fund future acquisitions or operating needs. If we raise additional funds through the sale of equity securities, these transactions may dilute the value of our outstanding common stock. We may also decide to issue securities, including debt securities that have rights, preferences and privileges senior to our common stock. We may be unable to raise additional funds on terms favorable to us or at all. If financing is not available or is not available on acceptable terms, we may be unable to fund our future needs. This may prevent us from increasing our market share, capitalizing on new business opportunities or remaining competitive in our industry.
Our balance sheet includes significant amounts of goodwill and other intangible assets. The impairment of a portion of these assets could negatively affect our business, financial condition and results of operations.
As a result of our acquisitions, a significant portion of our total assets are intangible assets (including goodwill). Goodwill and intangible assets, net of amortization, together accounted for approximately 83% of our total assets as of December 31, 2019. We expect to engage in additional acquisitions, which may result in our recognition of additional intangible assets, including goodwill. We evaluate on a regular basis whether all or a portion of our goodwill and other intangible assets may be impaired. Under current accounting rules, any determination that impairment has occurred would require us to record an impairment charge, which would negatively affect our earnings. An impairment of a portion of our goodwill or other intangible assets could have a material adverse effect on our business, financial condition and results of operations.
We may not be able to, or we may decide not to, pay dividends or repurchase shares at a level anticipated by our shareholders, which could reduce shareholder returns.
The extent to which we pay dividends on our common stock and repurchase our common stock in the future is at the discretion of our board of directors and will depend on, among other factors, our results of operations, financial condition, capital requirements and such other factors as our board of directors deems relevant. No assurance can be given that we will be able to or will choose to pay any dividends or repurchase any shares in the foreseeable future.
Our risk management policies and procedures may not be fully effective in mitigating our risk exposure in all market environments or against all types of risk.
We operate in a rapidly changing industry. Accordingly, our risk management policies and procedures may not be fully effective to identify, monitor and manage our risks. If our policies and procedures are not fully effective or if we are not always successful in identifying and mitigating all risks to which we are or may be exposed, we may suffer uninsured liability, harm to
24
our reputation or be subject to litigation or regulatory actions that could have a material adverse effect on our business, financial condition, results of operations and cash flows.
Failure to maintain effective internal controls in accordance with Section 404 of the Sarbanes-Oxley Act could have a material adverse effect on our business and stock price.
Section 404 of the Sarbanes-Oxley Act requires us to evaluate annually the effectiveness of our internal control over financial reporting as of the end of each year and to include a management report assessing the effectiveness of our internal control over financial reporting in our annual report. If we fail to maintain the adequacy of our internal controls, including, but not limited to, preventing unauthorized access to our systems, we may not be able to ensure that we can conclude on an ongoing basis that we have effective internal control over financial reporting in accordance with Section 404 of the Sarbanes-Oxley Act. Furthermore, this assessment may be complicated by any acquisitions we have completed or may complete.
In certain markets, including, without limitation, China, the Republic of Malta and Spain, our member sponsors perform payment processing operations and related support services pursuant to services agreements. We expect that the member sponsors will continue to provide these services until such time as we may integrate these functions into our operations. Accordingly, we rely on our member sponsors to provide financial data, such as amounts billed to merchants, to assist us with compiling our accounting records. As such, our internal control over financial reporting could be materially affected, or is reasonably likely to be materially affected, by the internal control and procedures of our member sponsors in these markets.
While we continue to dedicate resources and management time to ensuring that we have effective internal control over financial reporting, failure to achieve and maintain an effective internal control environment could have a material adverse effect on the market's perception of our business and on our stock price.
25
ITEM 2 - PROPERTIES
We have properties located in the United States and in countries outside the United States to support the geographic markets in which we conduct business. Our properties include office space and data centers most of which we lease. We believe that all of our properties will be suitable and adequate for our business as presently conducted. See "Note 6—Leases" in the notes to the accompanying consolidated financial statements for further discussion of our leases.
ITEM 3 - LEGAL PROCEEDINGS
We are party to a number of claims and lawsuits incidental to our business. In our opinion, the liabilities, if any, that may ultimately result from the outcome of such matters, individually or in the aggregate, are not expected to have a material adverse effect on our financial position, liquidity, results of operations or cash flows. See "Note 16—Commitments and Contingencies" in the notes to the accompanying consolidated financial statements for information about certain legal matters.
Part II
ITEM 5 - MARKET FOR REGISTRANT'S COMMON EQUITY, RELATED STOCKHOLDER MATTERS AND ISSUER PURCHASES OF EQUITY SECURITIES
Our common stock trades on the New York Stock Exchange under the ticker symbol "GPN." As of February 19, 2020, there were 14,180 shareholders of record.
Equity Compensation Plan Information
The information regarding our compensation plans under which equity securities are authorized for issuance is set forth in "Item 12—Security Ownership of Certain Beneficial Owners and Management and Related Stockholder Matters" of this Annual Report.
26
Stock Performance Graph
In 2016, we changed our fiscal year-end from May 31 to December 31. We refer to the period consisting of the seven-months ended December 31, 2016 as the "2016 fiscal transition period."
The following graph compares our cumulative shareholder returns with the Standard & Poor's Information Technology Index and the Standard & Poor's 500 Index for the years ended December 31, 2019, 2018 and 2017, the 2016 fiscal transition period and the years ended May 31, 2016 and 2015. The line graph assumes the investment of $100 in our common stock, the Standard & Poor's ("S&P") 500 Index and the Standard & Poor's Information Technology Index on May 31, 2014 and assumes reinvestment of all dividends.
COMPARISON OF 5-YEAR CUMULATIVE TOTAL RETURN*
Among Global Payments Inc., the S&P 500 Index
and the S&P Information Technology Index
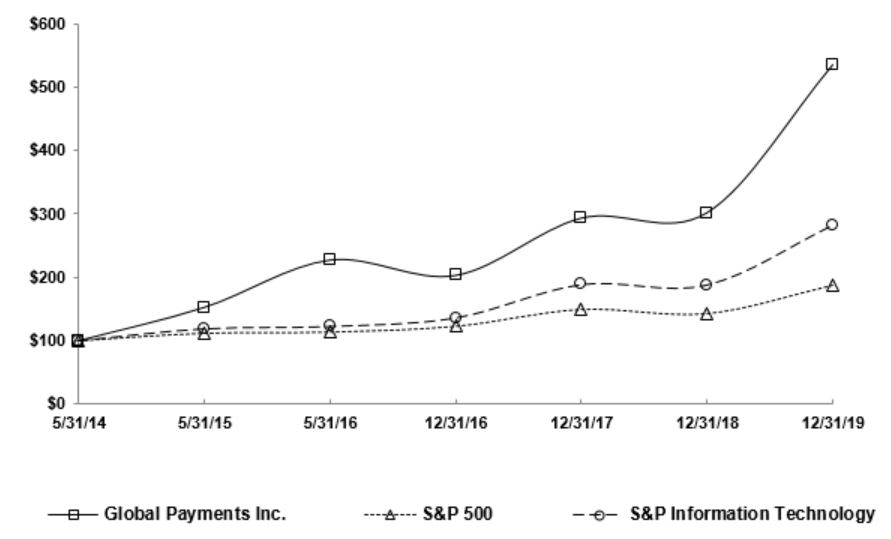
*$100 invested on May 31, 2014 in stock or index, including reinvestment of dividends.
Copyright© 2020 Standard & Poor's, a division of S&P Global. All rights reserved.
Global Payments | S&P 500 Index | S&P Information Technology Index | ||||||||||
May 31, 2014 | $ | 100.00 | $ | 100.00 | $ | 100.00 | ||||||
May 31, 2015 | 152.39 | 111.81 | 118.81 | |||||||||
May 31, 2016 | 226.99 | 113.72 | 122.52 | |||||||||
December 31, 2016 | 202.85 | 122.94 | 136.07 | |||||||||
December 31, 2017 | 293.09 | 149.78 | 188.91 | |||||||||
December 31, 2018 | 301.65 | 143.21 | 188.37 | |||||||||
December 31, 2019 | 534.68 | 188.31 | 283.10 | |||||||||
27
Recent Sales of Unregistered Securities
There were no unregistered sales of equity securities during the year ended December 31, 2019.
Issuer Purchases of Equity Securities
Information about the shares of our common stock that we repurchased during the quarter ended December 31, 2019 is set forth below:
Period | Total Number of Shares Purchased (1) | Approximate Average Price Paid per Share | Total Number of Shares Purchased as Part of Publicly Announced Plans or Programs | Maximum Number (or Approximate Dollar Value) of Shares that May Yet Be Purchased Under the Plans or Programs (2) | |||||||||
(in millions) | |||||||||||||
October 1-31, 2019 | 6,827 | $ | 160.70 | — | $ | 568.0 | |||||||
November 1-30, 2019 | 6,357 | 172.00 | — | 568.0 | |||||||||
December 1-31, 2019 | 629,195 | 182.06 | — | 568.0 | |||||||||
Total | 642,379 | $ | 181.74 | — | $ | 473.4 | |||||||
(1) | Our board of directors has authorized us to repurchase shares of our common stock through any combination of Rule 10b5-1 open-market repurchase plans, accelerated share repurchase plans, discretionary open-market purchases or privately negotiated transactions. |
During the quarter ended December 31, 2019, pursuant to our employee incentive plans, we withheld 122,617 shares at an average price per share of $180.77 in order to satisfy employees' tax withholding and payment obligations in connection with the vesting of awards of restricted stock, which we withheld at fair market value on the vesting date.
(2) | On February 5, 2019, the board of directors increased its authorization to repurchase shares of our common stock to $750 million, inclusive of prior share repurchase programs authorized by the board and repurchases made thereunder. As of December 31, 2019, the approximate dollar value of shares that may yet be purchased under our share repurchase program was $473.4 million. The authorizations by our board of directors do not expire, but could be revoked at any time. In addition, we are not required by any of our board's authorizations or otherwise to complete any repurchases by any specific time or at all. |
28
ITEM 6 - SELECTED FINANCIAL DATA
You should read the selected financial data set forth below in conjunction with (i) "Item 7 ‑ Management's Discussion and Analysis of Financial Condition and Results of Operations," (ii) "Item 8 ‑ Financial Statements and Supplementary Data" and (iii) the historical consolidated financial statements of Global Payments and the related notes presented in this Annual Report on Form 10-K.
Years Ended December 31, | Seven Months Ended December 31, 2016 | Years Ended May 31, | |||||||||||||||||||||
2019 | 2018 | 2017 | 2016 | 2015 | |||||||||||||||||||
(in thousands, except per share data) | |||||||||||||||||||||||
Income statement data: | |||||||||||||||||||||||
Revenues | $ | 4,911,892 | $ | 3,366,366 | $ | 3,975,163 | $ | 2,202,896 | $ | 2,898,150 | $ | 2,773,718 | |||||||||||
Operating income | 791,417 | 737,055 | 558,868 | 237,951 | 424,944 | 456,597 | |||||||||||||||||
Net income | 469,276 | 484,667 | 494,070 | 137,683 | 290,217 | 309,115 | |||||||||||||||||
Net income attributable to Global Payments | 430,613 | 452,053 | 468,425 | 124,931 | 271,666 | 278,040 | |||||||||||||||||
Per share data: | |||||||||||||||||||||||
Basic earnings per share | $ | 2.17 | $ | 2.85 | $ | 3.03 | $ | 0.81 | $ | 2.05 | $ | 2.07 | |||||||||||
Diluted earnings per share | 2.16 | 2.84 | 3.01 | 0.81 | 2.04 | 2.06 | |||||||||||||||||
Cash dividends declared per common share | 0.225 | 0.04 | 0.04 | 0.02 | 0.04 | 0.04 | |||||||||||||||||
Balance sheet data (at period end): | |||||||||||||||||||||||
Total assets | $ | 44,480,162 | $ | 13,230,774 | $ | 12,998,069 | $ | 10,664,350 | $ | 10,509,952 | $ | 5,779,301 | |||||||||||
Settlement lines of credit | 463,237 | 700,486 | 635,166 | 392,072 | 378,436 | 592,629 | |||||||||||||||||
Long-term debt | 9,125,501 | 5,130,243 | 4,659,716 | 4,438,612 | 4,515,286 | 1,740,067 | |||||||||||||||||
Total equity | 28,054,989 | 4,186,343 | 3,965,231 | 2,779,342 | 2,877,404 | 863,553 | |||||||||||||||||
As more fully described in "Note 1—Basis of Presentation and Summary of Significant Accounting Policies" and "Note 3—Revenues" in the notes to the accompanying consolidated financial statements, we adopted a new revenue accounting standard on January 1, 2018 that results in revenue being presented net of certain fees that we pay to third parties, including payment networks. This change in presentation affected our reported revenues and operating expenses for all periods after the year ended December 31, 2017 by the same amount and had no effect on operating income.
The selected financial data in the table above reflect the effects of acquisitions and borrowings to fund certain of those acquisitions. Notably, in 2019, we completed the Merger for total purchase consideration of $24.5 billion, primarily funded with shares of our common stock. We also restructured our long-term debt facilities to include a $5.0 billion credit facility, consisting of a senior unsecured $2.0 billion term loan and a $3.0 billion revolving loan facility, and unsecured senior notes of $3.0 billion. In addition, we also assumed $3.0 billion of TSYS' unsecured senior notes in the Merger. See "Note 2—Acquisitions" and "Note 7—Long-Term Debt and Lines of Credit," respectively, in the notes to the accompanying consolidated financial statements for further discussion of our acquisitions and borrowing arrangements.
Operating income, net income, net income attributable to Global Payments and basic and diluted earnings per share in the table above reflect acquisition and integration expenses of $255.6 million for the year ended December 31, 2019, primarily related to the Merger, $56.1 million for the year ended December 31, 2018, $94.6 million for the year ended December 31, 2017, $91.6 million for the seven months ended December 31, 2016 and $51.3 million for the year ended May 31, 2016.
Net income, net income attributable to Global Payments and basic and diluted earnings per share in the table above also reflect the following:
(a) the effects of a net income tax benefit of $23.3 million in connection with adjustments made to accounting estimates associated with the U.S. Tax Cuts and Jobs Act of 2017 ("2017 U.S. Tax Act") for the year ended December 31, 2018 and a provisional net income tax benefit of $158.7 million recorded in connection with the 2017 U.S. Tax Act for
29
the year ended December 31, 2017. See "Note 9—Income Tax" in the notes to the accompanying consolidated financial statements for further discussion; and
(b) a gain of $41.2 million recognized in connection with the sale of our membership interests in Visa Europe Limited for the seven months ended December 31, 2016.
ITEM 7 - MANAGEMENT'S DISCUSSION AND ANALYSIS OF FINANCIAL CONDITION AND RESULTS OF OPERATIONS
The following discussion and analysis of our financial condition and results of operations should be read in conjunction with "Item 6 - Selected Financial Data" and "Item 8 - Financial Statements and Supplementary Data." This discussion and analysis contains forward-looking statements about our plans and expectations of what may happen in the future. Forward-looking statements are based on a number of assumptions and estimates that are inherently subject to significant risks and uncertainties, and our actual results could differ materially from the results anticipated by our forward-looking statements as a result of many known and unknown factors, including but not limited to, those discussed in "Item 1A - Risk Factors." See "Cautionary Notice Regarding Forward-Looking Statements" located above in "Item 1 - Business."
Executive Overview
We are a leading pure play payments technology company delivering innovative software and services to our customers globally. Our technologies, services and employee expertise enable us to provide a broad range of solutions that allow our customers to operate their businesses more efficiently across a variety of channels around the world.
On September 18, 2019, we consummated our merger with Total System Services, Inc. ("TSYS") (the "Merger") for total purchase consideration of $24.5 billion, primarily funded with shares of our common stock. Prior to the Merger, TSYS was a leading global payments provider, offering seamless, secure and innovative solutions to issuers, merchants and consumers. See "Note 2—Acquisitions" in the notes to the accompanying consolidated financial statements for further discussion of the Merger.
We experienced strong business and financial performance around the world during the year ended December 31, 2019. Highlights related to our financial condition at December 31, 2019 and results of operations for the year then ended include the following:
• | Consolidated revenues increased to $4,911.9 million compared to $3,366.4 million for the prior-year period, primarily due to additional revenues from TSYS. |
• | Consolidated operating income increased to $791.4 million compared to $737.1 million for the prior-year period. Operating margin decreased to 16.1% compared to 21.9% for the prior-year period, primarily due to an increase in acquisition and integration expenses associated with the Merger. |
• | Net income attributable to Global Payments decreased to $430.6 million compared to $452.1 million for the prior-year period, reflecting increases in acquisition and integration expenses, amortization of acquired intangibles and interest expense from the prior-year period. |
• | Diluted earnings per share decreased to $2.16 compared to $2.84 for the prior-year period, reflecting the decrease in net income and an increase in the number of weighted-average shares outstanding as a result of issuing common shares as purchase consideration in the Merger. |
• | In connection with the Merger, we achieved an investment grade debt structure, which now consists of a $5.0 billion senior unsecured term loan and revolving credit facility, unsecured senior notes of $3.0 billion that we issued and $3.0 billion of TSYS' unsecured senior notes that we assumed in the Merger. |
Emerging Trends
For a further discussion of trends, uncertainties and other factors that could affect our continuing operating results, see the section entitled "Risk Factors" in Item 1A in this Annual Report on Form 10-K.
The payments technology industry continues to grow worldwide and as a result, certain large payment technology companies, including us, have expanded operations globally by pursuing acquisitions and creating alliances and joint ventures. We expect to
30
continue to expand into new markets internationally and increase our scale and improve our competitiveness in existing markets by pursuing additional acquisitions and joint ventures.
We believe that the number of electronic payment transactions will continue to grow and that an increasing percentage of these will be facilitated through emerging technologies. As a result, we expect an increasing portion of our future capital investment will be allocated to support the development of new and emerging technologies; however, we do not expect our aggregate capital spending to support such technologies to increase materially from our current level of spending.
We also believe new markets will continue to develop in areas that have been previously dominated by paper-based transactions. We expect industries such as education, government and healthcare, as well as recurring payments and business-to-business payments, to continue to see transactions migrate to electronic-based solutions. We anticipate that the continued development of new services and the emergence of new vertical markets will be a factor in the growth of our business and our revenue in the future.
For a further discussion of trends, uncertainties and other factors that could affect our continuing operating results, see the section entitled "Risk Factors" in Item 1A in this Annual Report on Form 10-K.
Results of Operations
Prior to the completion of the Merger, we operated in three reportable segments: North America, Europe and Asia-Pacific. In the fourth quarter of 2019, as a result of the Merger, we realigned our executive management and organizational structures. Based on an evaluation performed in accordance with the guidance provided in Accounting Standards Codification Topic 280, Segment Reporting, we determined that our new reportable segments as of December 31, 2019 were: Merchant Solutions, Issuer Solutions, and Business and Consumer Solutions. In connection with the organizational realignment, the legacy Global Payments businesses are included in the Merchant Solutions segment, with the exception of a small portion of our European business that is included in the Issuer Solutions segment. Certain operating expenses, that prior to the Merger were considered "enterprise-wide" expenses and reported in Corporate, are now reflected in the Merchant Solutions segment. For further information about our reportable segments, see "Item 1. Business—Business Segments" and "Note 15—Segment Information" in the notes to the accompanying consolidated financial statements, incorporated herein by reference.
The following discussion of our results recasts our segments for prior periods to conform to our new segment presentation. For a discussion of our results of operations for fiscal 2018 compared to fiscal 2017, refer to "Part II, Item 7. Management's Discussion and Analysis of Financial Condition and Results of Operations" in our Form 10-K for the year ended December 31, 2018, which was filed with the SEC on February 21, 2019.
Revenues
Merchant Solutions. The majority of our Merchant Solutions segment revenues is generated by services priced as a percentage of transaction value or a specified fee per transaction, depending on card type or the vertical. We also earn software subscription and licensing fees, as well as other fees based on specific value-added services that may be unrelated to the number or value of transactions. These revenues depend upon a number of factors, such as demand for and price of our services, the technological competitiveness of our offerings, our reputation for providing timely and reliable service, competition within our industry and general economic conditions.
We provide payment technology and software solutions to customers and fund settlement either directly, in markets where we have direct membership with the payment networks, or through our relationship with a member financial institution in markets where we are sponsored. Revenues are recognized in the amount of customer billing, net of interchange fees and payment network fees. We market our services through a variety of sales channels, including a direct sales force, trade associations, agent and enterprise software providers and referral arrangements with value-added resellers ("VARs"), which we generally refer to as "direct distribution." We also sell services to ISOs and financial institutions through our wholesale channel. In certain of these contracts, the ISO receives a share of the customer profitability in the form of a monthly residual payment, which is reflected as a component of selling, general and administrative expenses in the consolidated statements of income.
31
Issuer Solutions. Issuer Solutions segment revenues are derived from long-term processing contracts with financial institutions and other financial services providers. Payment processing services revenues are generated primarily from charges based on the number of accounts on file, transactions and authorizations processed, statements generated and/or mailed, managed services, cards embossed and mailed, and other processing services for cardholders accounts on file. Most of these contracts have prescribed annual minimums, penalties for early termination, and service level agreements that may affect contractual fees if specific service levels are not achieved. Issuer Solutions revenues also include loyalty redemption services and professional services.
Business and Consumer Solutions. Business and Consumer Solutions segment revenues principally consist of fees collected from cardholders and fees generated by cardholder activity in connection with the programs that we manage. Customers are typically charged a fee for each purchase transaction made using their cards, unless the customer is on a monthly or annual service plan, in which case the customer is instead charged a monthly or annual subscription fee, as applicable. Customers are also charged a monthly maintenance fee after a specified period of inactivity. We also charge fees associated with additional services offered in connection with certain cards, including the use of overdraft features, a variety of bill payment options, card replacement, foreign exchange and card-to-card transfers of funds initiated through our call centers. Revenues are recognized net of fees charged by the payment networks for services they provide in processing transactions routed through them.
Operating Expenses
Cost of Service
Cost of service consists primarily of salaries, wages and related expenses paid to operations and technology-related personnel, including those who monitor our transaction processing systems and settlement functions; the cost of transaction processing systems, including third-party services; the cost of network telecommunications capability; depreciation and occupancy costs associated with the facilities supporting these functions; amortization of intangible assets; amortization of costs to fulfill customer contracts; provisions for operating losses; and, when applicable, integration expenses.
Selling, General and Administrative Expenses
Selling, general and administrative expenses consist primarily of salaries, wages, commissions and related expenses paid to sales personnel, customer support functions other than those supporting revenue, administrative employees and management; share-based compensation expense; amortization of costs to obtain customer contracts; residuals paid to ISOs; fees paid to VARs, independent contractors and other third parties; other selling expenses; occupancy costs of leased space directly related to these functions; advertising costs; and, when applicable, acquisition and integration expenses.
Operating Income and Operating Margin
For the purpose of discussing segment operations, we refer to "operating income," which is calculated by subtracting segment direct expenses from segment revenues. Overhead and shared expenses, including share-based compensation, are not allocated to segment operations; they are reported in the caption "Corporate." Similarly, we refer to "operating margin" regarding segment operations, which is calculated by dividing segment operating income by segment revenues.
32
Year Ended December 31, 2019 Compared to Year Ended December 31, 2018
The following table sets forth key selected financial data for the years ended December 31, 2019 and 2018, this data as a percentage of total revenues, and the changes between periods in dollars and as a percentage of the prior-period amount. The income statement data for the years ended December 31, 2019 and 2018 are derived from the accompanying consolidated financial statements included in Item 8 - Financial Statements and Supplementary Data.
Year Ended December 31, | Year Ended December 31, | |||||||||||||||||||
(dollar amounts in thousands) | 2019 | % of Revenue(1) | 2018 | % of Revenue(1) | Change | % Change | ||||||||||||||
Revenues(2): | ||||||||||||||||||||
Merchant Solutions | $ | 4,098,580 | 83.4 | % | $ | 3,345,181 | 99.4 | % | $ | 753,399 | 22.5 | % | ||||||||
Issuer Solutions | 604,654 | 12.3 | % | 21,185 | 0.6 | % | 583,469 | NM | ||||||||||||
Business and Consumer Solutions | 227,440 | 4.6 | % | — | — | % | 227,440 | NM | ||||||||||||
Segment revenues | $ | 4,930,674 | 100.4 | % | $ | 3,366,366 | 100.0 | % | $ | 1,564,308 | 46.5 | % | ||||||||
Less: intersegment revenues | (18,782 | ) | (0.4 | )% | — | — | % | (18,782 | ) | NM | ||||||||||
Consolidated revenues | $ | 4,911,892 | 100.0 | % | $ | 3,366,366 | 100.0 | % | $ | 1,545,526 | 45.9 | % | ||||||||
Consolidated operating expenses(2): | ||||||||||||||||||||
Cost of service | $ | 2,073,803 | 42.2 | % | $ | 1,095,014 | 32.5 | % | $ | 978,789 | 89.4 | % | ||||||||
Selling, general and administrative | 2,046,672 | 41.7 | % | 1,534,297 | 45.6 | % | 512,375 | 33.4 | % | |||||||||||
Operating expenses | $ | 4,120,475 | 83.9 | % | $ | 2,629,311 | 78.1 | % | $ | 1,491,164 | 56.7 | % | ||||||||
Operating income (loss)(2)(3): | ||||||||||||||||||||
Merchant Solutions | $ | 1,148,975 | 23.4 | % | $ | 940,157 | 27.9 | % | $ | 208,818 | 22.2 | % | ||||||||
Issuer Solutions | 82,172 | 1.7 | % | 14,084 | 0.4 | % | 68,088 | NM | ||||||||||||
Business and Consumer Solutions | 19,473 | 0.4 | % | — | — | % | 19,473 | NM | ||||||||||||
Corporate | (459,203 | ) | (9.3 | )% | (217,186 | ) | (6.5 | )% | (242,017 | ) | 111.4 | % | ||||||||
Operating income | $ | 791,417 | 16.1 | % | $ | 737,055 | 21.9 | % | $ | 54,362 | 7.4 | % | ||||||||
Operating margin(2): | ||||||||||||||||||||
Merchant Solutions | 28.0 | % | 28.1 | % | (0.1 | )% | ||||||||||||||
Issuer Solutions | 13.6 | % | NM | NM | ||||||||||||||||
Business and Consumer Solutions | 8.6 | % | NM | NM | ||||||||||||||||
NM = Not meaningful.
(1) Percentage amounts may not sum to the total due to rounding.
(2) Revenues, operating expenses, operating income and operating margin reflect the effects of acquired businesses from the respective dates of acquisition. For further discussion, see "Note 2—Acquisitions" in the notes to the accompanying consolidated financial statements.
(3) During the year ended December 31, 2019, operating income for our Merchant Solutions segment reflected the effect of acquisition and integration expenses of $56.1 million. Operating loss for Corporate included acquisition and integration expenses of $199.5 million and $56.1 million, respectively, during the years ended December 31, 2019 and 2018. Acquisition and integration expenses for 2019 were primarily related to the Merger.
Revenues
Consolidated revenues for the year ended December 31, 2019 increased by 45.9% to $4,911.9 million, compared to $3,366.4 million for the prior-year period, primarily due to additional revenues from the acquired operations of TSYS. For the year ended
33
December 31, 2019, currency exchange rate fluctuations reduced our consolidated revenues by approximately $44 million, compared to the prior-year period, calculated by converting revenues for the current year, excluding revenues from current year acquisitions, in local currencies using exchange rates for the prior-year period. The effect of exchange rate fluctuations on our revenues was almost exclusively in our Merchant Solutions segment.
Merchant Solutions Segment. Revenues from our Merchant Solutions segment increased by 22.5% to $4,098.6 million, compared to $3,345.2 million for the prior-year period, primarily due to additional revenues from the acquired operations of TSYS.
Issuer Solutions and Business and Consumer Solutions Segments. Revenues from our Issuer Solutions and Business and Consumer Solutions segments resulted primarily from the additional revenues from the acquired operations of TSYS.
Operating Expenses
Cost of Service. Cost of service for the year ended December 31, 2019 increased by 89.4% to $2,073.8 million, compared to $1,095.0 million for the prior-year period, primarily due to additional costs associated with the acquired operations of TSYS. Cost of service for the year ended December 31, 2019 reflects amortization of acquired intangibles of $667.1 million, compared to $377.7 million for the prior-year period, and integration expenses of $41.8 million primarily related to the Merger. Cost of service as a percentage of revenues increased to 42.2% for the year ended December 31, 2019, compared to 32.5% for the prior-year period, primarily due to the increase in amortization of acquired intangibles of $289.5 million.
Selling, General and Administrative Expenses. Selling, general and administrative expenses for the year ended December 31, 2019 increased by 33.4% to $2,046.7 million, compared to $1,534.3 million for the prior-year period. The increase in selling, general and administrative expenses was primarily due to additional costs associated with the acquired operations of TSYS. In addition, selling, general and administrative expenses for the year ended December 31, 2019 reflect acquisition and integration expenses of $213.8 million, primarily related to the Merger, compared to $56.1 million for the prior-year period. Selling, general and administrative expenses as a percentage of revenues was 41.7% for the year ended December 31, 2019, compared to 45.6% for the prior-year period.
Corporate. Corporate expenses increased by $242.0 million to $459.2 million for the year ended December 31, 2019, compared to $217.2 million for the prior-year period, primarily due to additional expenses associated with the acquired operations of TSYS and an increase in acquisition and integration expenses primarily due to the Merger. During the years ended December 31, 2019 and 2018, operating loss for Corporate included acquisition and integration expenses of $199.5 million and $56.1 million, respectively. Certain of these Merger-related integration activities resulted in the recognition of one-time employee termination benefits. During the year ended December 31, 2019, we recognized charges of $57.1 million for actions taken to date, which included $17.3 million of share-based compensation expense based on accelerated vesting periods for equity awards held by terminated employees. In addition, we wrote-off capitalized software and other assets of $40.2 million for legacy Global Payments technology that will no longer be utilized for the combined company. We expect to incur additional charges as Merger-related integration activities continue in 2020.
Operating Income and Operating Margin
Consolidated operating income for the year ended December 31, 2019 increased to $791.4 million, compared to $737.1 million for the prior year due to additional income from TSYS of $78.7 million. For the year ended December 31, 2019, currency exchange rate fluctuations reduced our consolidated operating income by approximately $21 million, compared to the prior-year period, calculated by converting operating income for the current year, excluding operating income from current year acquisitions, in local currencies using exchange rates for the prior-year period. The effect of exchange rate fluctuations on our operating income was almost exclusively in our Merchant Solutions segment.
Operating margin for the year ended December 31, 2019 decreased to 16.1%, compared to 21.9% for the prior-year period. Consolidated operating income for the year ended December 31, 2019 reflects an increase in acquisition and integration expenses of $199.5 million, primarily due to the Merger, compared to the prior-year period, which was the primary reason for the decrease in operating margin from the prior-year period.
34
Other Income/Expense, Net
Interest and other income for the year ended December 31, 2019 increased by $10.7 million to $31.4 million, compared to the prior-year period, as a result of interest earned on the net proceeds from the issuance of our unsecured senior notes while they were in escrow. Interest and other income for the year ended December 31, 2018 included a gain of $9.6 million recognized on the reorganization of a debit network association of which we were a member through one of our Canadian subsidiaries.
Interest and other expense for the year ended December 31, 2019 increased by $109.3 million to $304.9 million, compared to the prior-year period, as a result of the increase in our long-term debt, including debt of $3,295.3 million that we assumed in the Merger. Further, we incurred fees and charges of $30.4 million in connection with financing activities related to the Merger, which were included in interest expense for the year ended December 31, 2019. These fees and charges included fees associated with bridge financing and charges for the write-off of unamortized debt issuance costs related to borrowings under the credit facility that was extinguished prior to the completion of the Merger.
Income Tax Expense
Our effective income tax rates for the years ended December 31, 2019 and 2018 were 12.0% and 13.8%, respectively. Our effective tax rate for the year ended December 31, 2019 reflects the effects of the Merger on our state tax expense, foreign-derived intangible income deduction and tax credits. Our effective tax rate for the year ended December 31, 2018 reflects the reduction of our estimated transition tax liability associated with the U.S. Tax Cuts and Jobs Act of 2017.
Equity in Income of Equity Method Investments, Net of Tax
As a result of the Merger, we have a 44.56% investment in China UnionPay Data Co., Ltd. ("CUP Data"), which we account for using the equity method of accounting. Equity in income of equity method investments, net of tax, primarily reflects our proportional share of earnings from our investment in CUP Data.
Liquidity and Capital Resources
In the ordinary course of our business, a significant portion of our liquidity comes from operating cash flows and borrowings, including the capacity under our credit facilities. Cash flow from operating activities is used to make planned capital investments in our business, to pursue acquisitions that meet our corporate objectives, to pay dividends, to pay principal and interest on our outstanding debt and to repurchase shares of our common stock. Accumulated cash balances are invested in high-quality, marketable short-term instruments.
Our capital plan objectives are to support our operational needs and strategic plan for long-term growth while maintaining a low cost of capital. We use a combination of bank financing, such as borrowings under our credit facilities and senior note issuances, for general corporate purposes and to fund acquisitions. In addition, specialized lines of credit are also used in certain of our markets to fund merchant settlement prior to receipt of funds from the card network. We regularly evaluate our liquidity and capital position relative to cash requirements, and we may elect to raise additional funds in the future, through the issuance of debt or equity or by other means.
At December 31, 2019, we had cash and cash equivalents totaling $1,678.3 million. Of this amount, we consider $981.7 million to be available for general purposes, of which $27.0 million is undistributed foreign earnings considered to be indefinitely reinvested outside the United States. The available cash of $981.7 million does not include the following: (i) settlement-related cash balances, (ii) funds held as collateral for merchant losses ("Merchant Reserves") and (iii) funds held for customers. Settlement-related cash balances represent funds that we hold when the incoming amount from the card networks precedes the funding obligation to the merchant. Settlement-related cash balances are not restricted; however, these funds are generally paid out in satisfaction of settlement processing obligations the following day. Merchant Reserves serve as collateral to minimize contingent liabilities associated with any losses that may occur under the merchant's agreement. While this cash is not restricted in its use, we believe that designating this cash to collateralize Merchant Reserves strengthens our fiduciary standing with our member sponsors and is in accordance with the guidelines set by the card networks. Funds held for customers and the corresponding liability that we record in customer deposits include amounts collected prior to remittance on our customers' behalf.
35
Operating activities provided net cash of $1,391.3 million and $1,106.1 million for the years ended December 31, 2019 and 2018, respectively, which reflect net income adjusted for noncash items, including depreciation and amortization and changes in operating assets and liabilities. Fluctuations in operating assets and liabilities are affected primarily by timing of month-end and transaction volume, especially changes in settlement processing assets and obligations, and by the effects of businesses we acquire that have different working capital requirements. Changes in settlement processing assets and obligations increased operating cash flows by $213.7 million and $83.5 million during the years ended December 31, 2019 and 2018, respectively. The increase in cash flows from operating activities from the prior-year period was primarily due to the increase in earnings before certain noncash items, including amortization of acquired intangibles and depreciation and amortization of property and equipment.
We used net cash in investing activities of $917.1 million and $1,476.3 million during the years ended December 31, 2019 and 2018, respectively. Cash used for investing activities primarily represents cash used to fund acquisitions, net of cash acquired, and capital expenditures. During the year ended December 31, 2019, we used cash of $1,093.6 million for acquisitions, including $703.6 million for the repayment of TSYS' unsecured revolving credit facility (including accrued interest and fees) and for cash paid to TSYS shareholders in lieu of fractional shares, all of which was partially offset by cash acquired in the Merger and other acquisitions of $448.9 million. During the year ended December 31, 2018, we used cash of $1,274.9 million for acquisitions, which was partially offset by cash acquired of $15.2 million.
We made capital expenditures of $307.9 million and $213.3 million to purchase property and equipment during the years ended December 31, 2019 and 2018, respectively. These investments include software and hardware to support the development of new technologies, continued consolidation and enhancement of our operating platforms and infrastructure to support our growing business.
Financing activities include borrowings and repayments made under our various debt arrangements, as well as borrowings and repayments made under specialized lines of credit to fund daily settlement activities. Our borrowing arrangements are further described in "Note 7—Long-Term Debt and Lines of Credit" in the notes to the accompanying consolidated financial statements and below under "Long-Term Debt and Lines of Credit." Financing activities also include cash flows associated with common stock repurchase programs and share-based compensation programs, as well as cash distributions made to noncontrolling interests and our shareholders. We used net cash in financing activities of $28.7 million during the year ended December 31, 2019, and cash flows from financing activities provided net cash of $286.9 million during the year ended December 31, 2018.
In connection with financing activities associated with the Merger, we received proceeds of $2,973.2 million from the issuance of senior unsecured notes and $2,868.0 million from our senior unsecured term loan and revolving credit facilities. We used these proceeds to repay TSYS' unsecured revolving credit facility, to refinance certain of our existing indebtedness, to fund cash payments made in lieu of fractional shares and to pay transaction fees and costs related to the Merger.
Repayments of long-term debt were $6,484.7 million and $2,304.3 million for the years ended December 31, 2019 and 2018, respectively. Repayments of long-term debt consist of repayments that we make with available cash, from time-to-time, under our revolving credit facility, as well as scheduled principal repayments we make on our term loans. During the year ended December 31, 2019, repayments of long-term debt also included $5,127.5 million for the repayment of all outstanding principal under our secured term loan and revolving credit facility, which we extinguished in connection with the Merger.
Activity under our settlement lines of credit is affected primarily by timing of month-end and transaction volume. During the year ended December 31, 2019, we had net repayments of settlement lines of credit of $236.5 million, and during the year ended December 31, 2018, we had net borrowings from settlement lines of credit of $70.8 million.
From time to time, we repurchase our common stock, mainly through open market repurchase plans. During the years ended December 31, 2019 and 2018, we used cash of $311.4 million and $208.2 million, respectively, to repurchase shares of our common stock. As of December 31, 2019, we had $473.4 million of share repurchase authority remaining under a share repurchase program authorized by our board of directors.
We paid dividends to our common shareholders in the amounts of $63.5 million and $6.3 million during the years ended December 31, 2019 and 2018. During the year ended December 31, 2019, we funded assumed dividends payable (declared by TSYS' board of directors prior to consummation of the Merger) to former TSYS shareholders in the amount of $23.2 million. During the
36
years ended December 31, 2019 and 2018, we made distributions to noncontrolling interest in the amounts of $31.6 million and $5.7 million, respectively.
We believe that our current level of cash and borrowing capacity under our senior unsecured revolving credit facility, together with expected future cash flows from operations, will be sufficient to meet the needs of our existing operations and planned requirements for the foreseeable future.
Long-Term Debt and Lines of Credit
Bridge Facility
On May 27, 2019, in connection with our entry into the merger agreement with TSYS, we obtained commitments for a $2.75 billion, 364-day senior unsecured bridge facility (the "Bridge Facility"). On July 9, 2019, upon our entry into the senior unsecured term loan and revolving credit facilities described below, the aggregate commitments under the Bridge Facility were reduced to approximately $2.1 billion. Concurrently with the issuance of our senior unsecured notes, the remaining aggregate commitments under the Bridge Facility were reduced to zero and terminated. During the year ended December 31, 2019, we recognized $11.7 million of fees associated with the Bridge Facility in interest expense.
Senior Unsecured Credit Facilities
On July 9, 2019, we entered into a term loan credit agreement ("Term Loan Credit Agreement") and a revolving credit agreement ("Unsecured Revolving Credit Agreement") in each case with Bank of America, N.A., as administrative agent, and a syndicate of financial institutions, as lenders and other agents. The Term Loan Credit Agreement provides for a senior unsecured $2.0 billion term loan facility, and the Unsecured Revolving Credit Agreement provides for a senior unsecured $3.0 billion revolving credit facility.
Borrowings under the term loan facility were made in U.S. dollars and borrowings under the revolving credit facility are available to be made in U.S. dollars, euros, sterling, Canadian dollars and, subject to certain conditions, certain other currencies at our option. Borrowings in U.S. dollars and certain other London Interbank Offered Rate ("LIBOR")-quoted currencies will bear interest, at our option, at a rate equal to either (1) the rate (adjusted for any statutory reserve requirements for eurocurrency liabilities) for eurodollar deposits in the London interbank market, (2) a floating rate of interest set forth on the applicable LIBOR screen page designated by Bank of America or (3) the highest of (a) the federal funds effective rate plus 0.5%, (b) the rate of interest as publicly announced by Bank of America as its "prime rate" or (c) LIBOR plus 1.0%, in each case, plus an applicable margin. As of December 31, 2019, borrowings outstanding under the term loan facility and the revolving credit facility were $2.0 billion and $903.0 million, respectively.
As of December 31, 2019, the interest rates on the term loan facility and the revolving credit facility were 3.2% and 3.0%, respectively. In addition, we are required to pay a quarterly commitment fee with respect to the unused portion of the revolving credit facility at an applicable rate per annum ranging from 0.125% to 0.300% depending on our credit rating. Beginning on December 31, 2022, and at the end of each quarter thereafter, the term loan facility must be repaid in quarterly installments in the amount of 2.50% of original principal through the maturity date with the remaining principal balance due upon maturity in September 2024. The revolving credit facility also matures in September 2024.
We may issue standby letters of credit of up to $250 million in the aggregate under the revolving credit facility. Outstanding letters of credit under the revolving credit facility reduce the amount of borrowings available to us. The total available commitments under the revolving credit facility at December 31, 2019 were $2,077.5 million.
37
Senior Unsecured Notes
On August 14, 2019, we completed the public offering and issuance of $3.0 billion aggregate principal amount of senior unsecured notes, consisting of the following: (i) $1.0 billion aggregate principal amount of 2.650% senior notes due 2025; (ii) $1.25 billion aggregate principal amount of 3.200% senior notes due 2029; and (iii) $750.0 million aggregate principal amount of 4.150% senior notes due 2049. Interest on the senior notes is payable semi-annually in arrears on each February 15 and August 15, beginning on February 15, 2020. Each series of the senior notes is redeemable, at our option, in whole or in part, at any time and from time-to-time at the redemption prices set forth in the related indenture. We issued the senior notes at a total discount of $6.1 million and capitalized related debt issuance costs of $29.6 million.
From August 14, 2019 until the closing of the Merger on September 18, 2019, the proceeds from the issuance of the senior notes were held in escrow. Upon closing, the funds were released and used together with borrowings under the term loan facility and the revolving credit facility, as well as cash on hand, to repay TSYS' unsecured revolving credit facility, refinance certain of our existing indebtedness, fund cash payments made in lieu of fractional shares and pay transaction fees and costs related to the Merger.
In addition, in connection with the Merger, we assumed $3.0 billion aggregate principal amount of senior unsecured notes of TSYS, consisting of the following: (i) $750 million aggregate principal amount of 3.800% senior notes due 2021; (ii) $550 million aggregate principal amount of 3.750% senior notes due 2023; (iii) $550 million aggregate principal amount of 4.000% senior notes due 2023; (iv) $750 million aggregate principal amount of 4.800% senior notes due 2026; and (v) $450 million aggregate principal amount of 4.450% senior notes due 2028. For the 3.800% senior notes due 2021 and the 4.800% senior notes due 2026, interest is payable semi-annually each April 1 and October 1. For the 3.750% senior notes due 2023, the 4.000% senior notes due 2023 and the 4.450% senior notes due 2028, interest is payable semi-annually each June 1 and December 1.
Prior Credit Facility
Prior to completion of the Merger, we were party to a credit facility agreement with Bank of America, N.A., as administrative agent, and a syndicate of financial institutions, as lenders and other agents. The credit facility provided for secured financing comprised of (i) a $1.50 billion revolving credit facility; (ii) a $1.5 billion term loan; (iii) a $1.37 billion term loan; (iv) a $1.140 billion term loan; and (v) a $500.0 million term loan. Upon the consummation of the Merger, all borrowings outstanding and other amounts due under the credit facility were repaid and this credit facility was terminated.
Compliance with Covenants
The senior unsecured term loan and revolving credit facilities contain customary conditions to funding, affirmative covenants, negative covenants, financial covenants and events of default. As of December 31, 2019, financial covenants under the term loan facility required a leverage ratio of 3.50 to 1.00 and an interest coverage ratio of 3.00 to 1.00. We were in compliance with all applicable covenants as of December 31, 2019.
Settlement Lines of Credit
In various markets where we do business, we have specialized lines of credit, which are restricted for use in funding settlement. The settlement lines of credit generally have variable interest rates, are subject to annual review and are denominated in local currency but may, in some cases, facilitate borrowings in multiple currencies. For certain of our lines of credit, the available credit is increased by the amount of cash we have on deposit in specific accounts with the lender. Accordingly, the amount of the outstanding line of credit may exceed the stated credit limit. As of December 31, 2019 and 2018, a total of $74.5 million and $70.6 million, respectively, of cash on deposit was used to determine the available credit.
As of December 31, 2019, we had $463.2 million outstanding under these lines of credit with additional capacity to fund settlement of $981.8 million. During the year ended December 31, 2019, the maximum and average outstanding balances under these lines of credit were $882.6 million and $423.2 million, respectively. The weighted-average interest rate on these borrowings was 3.16% at December 31, 2019.
See "Note 6—Leases" and "Note 7—Long-Term Debt and Lines of Credit" in the notes to the accompanying consolidated financial statements for further information about our borrowing agreements and our lease liabilities.
38
Off-Balance Sheet Arrangements
We have not entered into any off-balance sheet arrangements that have, or are reasonably likely to have, a material effect on our financial condition, revenues, results of operations, liquidity, capital expenditures or capital resources, other than the guarantee services described in "Note 1—Basis of Presentation and Summary of Significant Accounting Policies" in the notes to the accompanying consolidated financial statements.
BIN/ICA Agreements
We have entered into sponsorship or depository and processing agreements with certain banks. These agreements allow us to use the banks' identification numbers, referred to as Bank Identification Number ("BIN") for Visa transactions and Interbank Card Association ("ICA") number for Mastercard transactions, to clear credit card transactions through Visa and Mastercard. Certain of such agreements contain financial covenants, and we were in compliance with all such covenants as of December 31, 2019.
Commitments and Contractual Obligations
The following table summarizes estimates of our contractual obligations and commitments as of December 31, 2019:
Payments Due by Future Period | |||||||||||||||||||
Total | Less than 1 Year | 1-3 Years | 3-5 Years | More Than 5 Years | |||||||||||||||
(in thousands) | |||||||||||||||||||
Long-term debt | $ | 8,986,456 | $ | 28,512 | $ | 804,944 | $ | 3,953,000 | $ | 4,200,000 | |||||||||
Interest on long-term debt(1) | 2,544,547 | 337,627 | 626,346 | 484,473 | 1,096,101 | ||||||||||||||
Operating lease obligations(2) | 576,669 | 106,787 | 186,696 | 106,067 | 177,119 | ||||||||||||||
Settlement lines of credit | 463,237 | 463,237 | — | — | — | ||||||||||||||
Purchase obligations(3) | 336,759 | 125,533 | 126,033 | 56,475 | 28,718 | ||||||||||||||
Finance lease liabilities | 35,341 | 7,402 | 14,279 | 13,457 | 203 | ||||||||||||||
(1) Interest on long-term debt is based on effective rates and amounts borrowed as of December 31, 2019 and includes the estimated effect of interest rate swaps. Since the contractual rates for our long-term debt and settlements on our interest rate swaps are variable, actual cash payments may differ from the estimates provided.
(2) Operating lease obligations did not include approximately $64.0 million for operating leases that had not yet commenced at December 31, 2019.
(3) Includes an estimate of future payments for noncancelable contractual obligations related to service arrangements with suppliers for fixed or minimum amounts.
The table above excludes other obligations that we may have, such as employee benefit obligations and other noncurrent liabilities reflected in our consolidated balance sheet, because the timing of the related payments is not determinable or because there is no contractual obligation associated with the underlying obligations.
Critical Accounting Policies and Estimates
Our consolidated financial statements have been prepared in accordance with accounting principles generally accepted in the United States, which often require the judgment of management in the selection and application of certain accounting principles and methods. We consider the following accounting policies to be critical to understanding our consolidated financial statements because the application of these policies requires significant judgment on the part of management, and as a result, actual future developments may be different from those expected at the time that we make these critical judgments. We have discussed these critical accounting policies with the audit committee of the board of directors.
39
Accounting estimates necessarily require subjective determinations about future events and conditions. Therefore, the following descriptions of our critical accounting policies are forward-looking statements, and actual results could differ materially from the results anticipated by these forward-looking statements. You should read the following in conjunction with "Note 1—Basis of Presentation and Summary of Significant Accounting Policies" of the notes to the accompanying consolidated financial statements and the risk factors contained in "Item 1A - Risk Factors" of this Annual Report on Form 10-K.
Business Combinations
From time to time, we make strategic acquisitions that may have a material effect on our consolidated results of operations or financial position. We record the assets acquired and the liabilities assumed in a business combination at estimated fair value as of the acquisition date. The excess amount of the total consideration paid over the estimated fair value of the net identifiable assets acquired is recorded as goodwill.
The estimates we use to determine the fair value of long-lived assets, such as intangible assets, can be complex and require significant judgments. We use information available to us to make fair value determinations and engage independent valuation specialists, when necessary, to assist in the fair value determination of significant acquired long-lived assets. The estimated fair values of customer-related and contract-based intangible assets are generally determined using the income approach, which is based on projected cash flows discounted to their present value using discount rates that consider the timing and risk of the forecasted cash flows. The discount rates used represented the average estimated value of a market participant’s cost of capital and debt, derived using customary market metrics. These measures of fair value also require considerable judgments about future events, including forecasted revenue growth rates, forecasted customer attrition rates, contract renewal estimates and technology changes. Acquired technologies are generally valued using the replacement cost method, which requires us to estimate the costs to construct an asset of equivalent utility at prices available at the time of the valuation analysis, with adjustments in value for physical deterioration and functional and economic obsolescence. Trademarks and trade names are generally valued using the "relief-from-royalty" approach. This method assumes that trademarks and trade names have value to the extent that their owner is relieved of the obligation to pay royalties for the benefits received from them. This method requires us to estimate the future revenues for the related brands, the appropriate royalty rate and the weighted-average cost of capital. This measure of fair value requires considerable judgment about the value a market participant would be willing to pay in order to achieve the benefits associated with the trade name.
While we use our best estimates and assumptions to determine the fair values of the assets acquired and the liabilities assumed, our estimates are inherently uncertain and subject to refinement. As a result, during the measurement period, which may be up to one year from the acquisition date, we record adjustments to the assets acquired and liabilities assumed. Upon the conclusion of the measurement period, any subsequent adjustments are recorded to our consolidated statements of income. We are also required to estimate the useful lives of intangible assets to determine the amount of acquisition-related intangible asset amortization expense to record in future periods. The determination of asset lives affects our results of operations as different types of assets have different useful lives and certain assets may be considered to have indefinite useful lives. We periodically review the estimated useful lives assigned to our intangible assets to determine whether such estimated useful lives continue to be appropriate.
Goodwill—We perform our annual goodwill impairment test as of October 1 each year. We test goodwill for impairment at the reporting unit level annually and more often if an event occurs or circumstances change that indicate the fair value of a reporting unit is below its carrying amount. We have the option of performing a qualitative assessment of impairment to determine whether any further quantitative assessment for impairment is necessary. The option of whether or not to perform a qualitative assessment is made annually and may vary by reporting unit.
Factors we consider in the qualitative assessment include general macroeconomic conditions, industry and market conditions, cost factors, overall financial performance of our reporting units, events or changes affecting the composition or carrying amount of the net assets of our reporting units, sustained decrease in our share price, and other relevant entity-specific events. If we elect to bypass the qualitative assessment or if we determine, on the basis of qualitative factors, that the fair value of the reporting unit is more likely than not less than the carrying amount, a quantitative test would be required.
Prior to the Merger, our reporting units consisted of: North America Payments, Integrated Solutions and Vertical Markets, United Kingdom, Asia-Pacific, Central and Eastern Europe, Russia and Spain. As of October 1, 2019, we elected to perform a quantitative assessment of impairment for each of these reporting units, and determined on the basis of those assessments that the
40
fair value of each reporting unit is equal to or greater than its respective carrying amount. As of October 1, 2019, we had not allocated goodwill associated with the Merger to any of our reporting units; however, no indicators of impairment existed that warranted further evaluation of the provisional goodwill.
After October 1, 2019, as a result of the Merger, we realigned our reporting units based on new executive management and organizational structures so that they consisted of: North America Payment Solutions, Integrated Solutions, Vertical Market Software Solutions, Europe Merchant Solutions, Spain Merchant Solutions, Asia-Pacific Merchant Solutions, Issuer Solutions and Business and Consumer Solutions. After the reorganization of our reporting units, we performed a quantitative assessment of impairment for each of our new reporting units, and determined on the basis of those assessments that the fair value of each reporting unit is equal to or greater than its respective carrying amount. We believe that the fair value of each of our reporting units is substantially in excess of its carrying amount, except for Issuer Solutions and Business and Consumer Solutions for which the respective carrying amounts approximate fair value since they were recently acquired in the Merger.
Intangible and Long-lived Assets—Intangible assets are amortized over their estimated useful lives. The useful lives for customer-related intangible assets are determined based primarily on forecasted cash flows, which include estimates for the revenues, expenses, and customer attrition associated with the assets. The useful lives of contract-based intangible assets are equal to the terms of the agreements. The useful lives of amortizable trademarks and trade names are based on our plans to phase out the trademarks and trade names in the applicable markets. We use the straight-line method of amortization for our amortizable acquired technologies, trademarks and trade names and contract-based intangibles.
Amortization for most of our customer-related intangible assets is determined using an accelerated method. The first step in determining the amortization expense for any period is that we calculate the expected cash flows for that period that were used in determining the acquisition-date fair value of the asset divided by the expected total cash flows over the estimated life of the asset. We then multiply that percentage by the initial carrying amount of the asset to arrive at the amortization expense for that period. If the cash flow patterns that we experience differ significantly from our initial estimates, we adjust the amortization schedule prospectively. These cash flow patterns are derived using certain assumptions and cost allocations due to a significant number of asset interdependencies that exist in our business. We believe that our accelerated method reflects the expected pattern of the benefit to be derived from the acquired customer relationships. We did not make any significant adjustments to the amortization schedules of our intangible assets during the year ended December 31, 2019.
We regularly evaluate whether events and circumstances have occurred that indicate the carrying amount of property and equipment and finite-life intangible assets may not be recoverable. When factors indicate that these long-lived assets should be evaluated for possible impairment, we assess the potential impairment by determining whether the carrying amount of such long-lived assets will be recovered through the future undiscounted cash flows expected from use of the asset and its eventual disposition. The evaluation is performed at the asset group level, which is the lowest level of identifiable cash flows. If the carrying amount of the asset group is determined not to be recoverable and exceeds its fair value, an impairment loss is recorded, measured as the difference between the fair value and the carrying amount. Fair values are determined based on quoted market prices or discounted cash flow analysis as applicable. We regularly evaluate whether events and circumstances have occurred that indicate the useful lives of property and equipment and finite-life intangible assets may warrant revision.
Capitalization of Internal-Use Software
We develop software that is used in providing services to customers. Capitalization of internal-use software, primarily associated with operating platforms, occurs when we have completed the preliminary project stage, management authorizes the project, management commits to funding the project, it is probable the project will be completed and the project will be used to perform the function intended. The preliminary project stage consists of the conceptual formulation of alternatives, the evaluation of alternatives, the determination of existence of needed technology and the final selection of alternatives. Costs incurred during the preliminary project stage are expensed as incurred. Currently unforeseen circumstances in software development, such as a significant change in the manner in which the software is intended to be used, obsolescence or a significant reduction in revenues due to merchant attrition, could require us to implement alternative plans with respect to a particular effort, which could result in the impairment of previously capitalized software development costs. The carrying amount of internal-use software, including work-in-progress, at December 31, 2019 was $452.7 million. Costs capitalized during the year ended December 31, 2019 totaled $95.9 million. Internal-use software is amortized over its estimated useful life, which is typically 2 to 10 years, in a manner that best reflects the pattern of economic use of the assets.
41
During the fourth quarter of 2019, we preliminarily determined our target technology architecture for the combined company. As a result, we wrote-off capitalized software assets of $31.1 million related to legacy Global Payments technology that will no longer be utilized.
Revenue Recognition
We adopted Accounting Standards Update 2014-09, "Revenues from Contracts with Customers" as well as other clarifications and technical guidance issued by the Financial Accounting Standards Board related to this new revenue standard ("ASC 606") and ASC Subtopic 340-40: "Other Assets and Deferred Costs - Contracts with Customers" on January 1, 2018. We apply judgment in the determination of performance obligations in accordance with ASC 606, in particular related to large customer contracts within the Issuer Solutions segment. Performance obligations in a contract are identified based on the goods or services that will be transferred to the customer that are both capable of being distinct, whereby the customer can benefit from the service either on its own or together with other resources that are readily available from third parties or from us, and are distinct in the context of the contract, whereby the transfer of the services is separately identifiable from other promises in the contract. To the extent a contract includes multiple promised services, we must apply judgment to determine whether promised services are capable of being distinct and are distinct in the context of the contract. If these criteria are not met, the promised services are combined and accounted for as a single performance obligation. In addition, a single performance obligation may comprise a series of distinct goods or services that are substantially the same and that have the same pattern of transfer to the customer.
Income Taxes
We determine our provision for income taxes using management's judgments, estimates and the interpretation and application of complex tax laws in each of the jurisdictions in which we operate. Judgment is also required in assessing the timing and amounts of deductible and taxable items. These differences result in deferred tax assets and liabilities in our consolidated balance sheet.
We believe our tax return positions are fully supportable; however, we recognize the benefit for tax positions only when it is more likely than not that the position will be sustained based on its technical merits. Issues raised by a tax authority may be resolved at an amount different than the related benefit recognized. When facts and circumstances change (including an effective settlement of an issue or statute of limitations expiration), the effect is recognized in the period of change. The unrecognized tax benefits that exist at December 31, 2019 would affect our provision for income taxes in the future, if recognized. Judgment is required to determine whether or not some portion or all of our deferred tax assets will not be realized. To the extent we determine that we will not realize the benefit of some or all of our deferred tax assets, then these deferred tax assets are adjusted through our provision for income taxes in the period in which this determination is made.
Effect of New Accounting Pronouncements - Recently Issued Pronouncements Not Yet Adopted
Refer to "Note 1—Basis of Presentation and Summary of Significant Accounting Policies" in the notes to the accompanying consolidated financial statements for information on recently issued accounting pronouncements not yet adopted.
ITEM 7A - QUANTITATIVE AND QUALITATIVE DISCLOSURES ABOUT MARKET RISK
Foreign Currency Exchange Rate Risk
Certain of our operations are conducted in foreign currencies. Consequently, a portion of our revenues and expenses may be affected by fluctuations in foreign currency exchange rates. We have not historically hedged our translation risk on foreign currency exposure, but we may do so in the future. For the year ended December 31, 2019, currency exchange rate fluctuations reduced our consolidated revenues by approximately $44 million and reduced our operating income by approximately $21 million compared to the prior-year period, calculated by converting revenues and operating income, respectively, for the current year, excluding revenues and operating income from current year acquisitions, in local currencies using exchange rates for the prior-year period.
Generally, the functional currency of our various subsidiaries is their local currency. We are exposed to currency fluctuations on transactions that are not denominated in the functional currency. Gains and losses on such transactions are included in determining
42
net income for the period. We seek to mitigate our foreign currency risk through timely settlement of transactions and cash flow matching, when possible. For the year ended December 31, 2019, our transaction gains and losses were insignificant.
Additionally, we are affected by currency fluctuations in our funds settlement process on merchant payment, chargeback and card network settlement transactions that are not denominated in the currency of the underlying credit or debit card transaction. Gains and losses on these transactions are included in revenues for the period.
We are also affected by fluctuations in exchange rates on our investments in foreign operations. Relative to our net investment in foreign operations, the assets and liabilities of subsidiaries whose functional currency is a foreign currency are translated at the period-end rate of exchange. The resulting translation adjustment is recorded as a component of other comprehensive income and is included in shareholders' equity. Transaction gains and losses on intercompany balances of a long-term investment nature are also recorded as a component of other comprehensive income.
Interest Rate Risk
We are exposed to market risk related to changes in interest rates on certain of our long-term borrowings and cash investments. We invest our excess cash in securities that we believe are highly liquid and marketable in the short term. These investments earn a floating rate of interest and are not held for trading or other speculative purposes.
We have a senior unsecured $2.0 billion term loan facility and a senior unsecured $3.0 billion revolving credit facility, as well as various lines of credit that we use to fund settlement in certain of our markets, each of which bears interest at rates that are based on market rates and fluctuate accordingly. As of December 31, 2019, the amount outstanding under these variable-rate debt arrangements and settlement lines of credit was $3.4 billion.
The interest earned on our invested cash and the interest paid on our debt are based on variable interest rates; therefore, the exposure of our net income to a change in interest rates is partially mitigated as an increase in rates would increase both interest income and interest expense, and a reduction in rates would decrease both interest income and interest expense. Under our current policies, we may selectively use derivative instruments, such as interest rate swaps or forward rate agreements, to manage all or a portion of our exposure to interest rate changes. We have entered into interest rate swaps that reduce a portion of our exposure to market interest rate risk on certain of our variable-rate debt as discussed in "Note 7—Long-Term Debt and Lines of Credit" in the notes to our accompanying consolidated financial statements.
Based on balances outstanding under variable-rate debt agreements and invested cash balances at December 31, 2019, a hypothetical increase of 50 basis points in applicable interest rates as of December 31, 2019 would increase our annual interest expense by approximately $7.4 million and increase our annual interest income by approximately $2.8 million.
43
ITEM 8 - FINANCIAL STATEMENTS AND SUPPLEMENTARY DATA
REPORT OF INDEPENDENT REGISTERED PUBLIC ACCOUNTING FIRM
To the shareholders and the Board of Directors of Global Payments Inc.
Opinion on Internal Control over Financial Reporting
We have audited the internal control over financial reporting of Global Payments Inc. and subsidiaries (the "Company") as of December 31, 2019, based on criteria established in Internal Control - Integrated Framework (2013) issued by the Committee of Sponsoring Organizations of the Treadway Commission (COSO). In our opinion, the Company maintained, in all material respects, effective internal control over financial reporting as of December 31, 2019, based on criteria established in Internal Control - Integrated Framework (2013) issued by COSO.
We have also audited, in accordance with the standards of the Public Company Accounting Oversight Board (United States) (PCAOB), the consolidated financial statements and financial statement schedule as of and for the year ended December 31, 2019, of the Company and our report dated February 21, 2020, expressed an unqualified opinion on those financial statements and included an explanatory paragraph regarding the Company's change in its method of accounting for revenue from contracts with customers in fiscal year 2018, due to the adoption of Accounting Standards Codification ("ASC") Topic 606, Revenue from Contracts with Customers and an explanatory paragraph regarding the Company’s change in its method of accounting for leases in fiscal year 2019 due to the adoption of ASC Topic 842, Leases. As described in Management's Report on Internal Control over Financial Reporting, the Company consummated its merger with Total System Services, Inc. ("TSYS") on September 18, 2019, and management excluded from its assessment of internal control over financial reporting the acquired operations of TSYS, which constituted approximately 32% of consolidated assets, excluding goodwill, approximately 25% of consolidated revenues, and approximately 10% of consolidated operating income, as of and for the year ended December 31, 2019. Accordingly, our audit did not include the internal control over financial reporting of the acquired operations of TSYS that is excluded from management’s assessment.
Basis for Opinion
The Company's management is responsible for maintaining effective internal control over financial reporting and for its assessment of the effectiveness of internal control over financial reporting, included in the accompanying Management's Report on Internal Control over Financial Reporting. Our responsibility is to express an opinion on the Company’s internal control over financial reporting based on our audit. We are a public accounting firm registered with the PCAOB and are required to be independent with respect to the Company in accordance with the U.S. federal securities laws and the applicable rules and regulations of the Securities and Exchange Commission and the PCAOB.
We conducted our audit in accordance with the standards of the PCAOB. Those standards require that we plan and perform the audit to obtain reasonable assurance about whether effective internal control over financial reporting was maintained in all material respects. Our audit included obtaining an understanding of internal control over financial reporting, assessing the risk that a material weakness exists, testing and evaluating the design and operating effectiveness of internal control based on the assessed risk, and performing such other procedures as we considered necessary in the circumstances. We believe that our audit provides a reasonable basis for our opinion.
Definition and Limitations of Internal Control over Financial Reporting
A company's internal control over financial reporting is a process designed to provide reasonable assurance regarding the reliability of financial reporting and the preparation of financial statements for external purposes in accordance with generally accepted accounting principles. A company's internal control over financial reporting includes those policies and procedures that (1) pertain to the maintenance of records that, in reasonable detail, accurately and fairly reflect the transactions and dispositions of the assets of the company; (2) provide reasonable assurance that transactions are recorded as necessary to permit preparation of financial statements in accordance with generally accepted accounting principles, and that receipts and expenditures of the company are being made only in accordance with authorizations of management and directors of the company; and (3) provide reasonable assurance regarding prevention or timely detection of unauthorized acquisition, use, or disposition of the company’s assets that
44
could have a material effect on the financial statements.
Because of its inherent limitations, internal control over financial reporting may not prevent or detect misstatements. Also, projections of any evaluation of effectiveness to future periods are subject to the risk that controls may become inadequate because of changes in conditions, or that the degree of compliance with the policies or procedures may deteriorate.
/s/ DELOITTE & TOUCHE LLP
Atlanta, Georgia
February 21, 2020
45
REPORT OF INDEPENDENT REGISTERED PUBLIC ACCOUNTING FIRM
To the shareholders and the Board of Directors of Global Payments Inc.
Opinion on the Financial Statements
We have audited the accompanying consolidated balance sheets of Global Payments Inc. and subsidiaries (the "Company") as of December 31, 2019 and 2018, the related consolidated statements of income, comprehensive income, changes in equity, and cash flows, for each of the three years in the period ended December 31, 2019, and the related notes and the schedule listed in the Index at Item 15 (collectively referred to as the "financial statements"). In our opinion, the financial statements present fairly, in all material respects, the financial position of the Company as of December 31, 2019 and 2018, and the results of its operations and its cash flows for each of the three years in the period ended December 31, 2019, in conformity with the applicable accounting principles generally accepted in the United States of America.
We have also audited, in accordance with the standards of the Public Company Accounting Oversight Board (United States) (PCAOB), the Company's internal control over financial reporting as of December 31, 2019, based on criteria established in Internal Control - Integrated Framework (2013) issued by the Committee of Sponsoring Organizations of the Treadway Commission and our report dated February 21, 2020, expressed an unqualified opinion on the Company's internal control over financial reporting.
Change in Accounting Principle
As discussed in Note 1 to the consolidated financial statements, the Company has changed its method of accounting for revenue from contracts with customers in fiscal year 2018 due to the adoption of Accounting Standards Codification Topic 606, Revenue from Contracts with Customers.
As discussed in Note 1 to the consolidated financial statements, the Company has changed its method of accounting for leases in fiscal year 2019 due to the adoption of Accounting Standards Codification Topic 842, Leases.
Basis for Opinion
These financial statements are the responsibility of the Company's management. Our responsibility is to express an opinion on the Company's financial statements based on our audits. We are a public accounting firm registered with the PCAOB and are required to be independent with respect to the Company in accordance with the U.S. federal securities laws and the applicable rules and regulations of the Securities and Exchange Commission and the PCAOB.
We conducted our audits in accordance with the standards of the PCAOB. Those standards require that we plan and perform the audit to obtain reasonable assurance about whether the financial statements are free of material misstatement, whether due to error or fraud. Our audits included performing procedures to assess the risks of material misstatement of the financial statements, whether due to error or fraud, and performing procedures that respond to those risks. Such procedures included examining, on a test basis, evidence regarding the amounts and disclosures in the financial statements. Our audits also included evaluating the accounting principles used and significant estimates made by management, as well as evaluating the overall presentation of the financial statements. We believe that our audits provide a reasonable basis for our opinion.
Critical Audit Matters
The critical audit matters communicated below are matters arising from the current-period audit of the financial statements that were communicated or required to be communicated to the audit committee and that (1) relate to accounts or disclosures that are material to the financial statements and (2) involved our especially challenging, subjective, or complex judgments. The communication of critical audit matters does not alter in any way our opinion on the financial statements, taken as a whole, and we are not, by communicating the critical audit matters below, providing separate opinions on the critical audit matters or on the accounts or disclosures to which they relate.
46
Merger with Total System Services, Inc. Merger - Refer to Note 2 to financial statements
Critical Audit Matter Description
The Company completed the merger with Total System Services, Inc. for consideration of $24.5 billion on September 18, 2019. The Company accounted for the transaction as a business combination by applying the acquisition method of accounting. Accordingly, the assets acquired and liabilities assumed were recognized at their respective fair values. Management estimated the fair value of the customer relationship intangible assets for the Issuer Solutions segment, the most significant intangible asset acquired, using the income approach, which is based on projected cash flows discounted to their present value using discount rates that consider the timing and risk of the future cash flows. The fair value determination of the customer relationship intangible asset required management to make significant estimates and assumptions related to future cash flows, including the forecasted rate of revenue growth, rate of customer attrition and the selection of the discount rate.
Designing and performing audit procedures to evaluate the reasonableness of these estimates and assumptions required a high degree of auditor judgment and an increased extent of effort, including the need to involve our fair value specialists.
How the Critical Audit Matter Was Addressed in the Audit
Our audit procedures related to revenue growth, future customer attrition and discount rates (key assumptions) for the Issuer Solutions customer relationship intangible asset included the following, among others:
• | We tested the effectiveness of controls over the valuation of the customer relationship intangible asset, including management's controls over forecasts of future cash flows and the selection of the revenue growth rate, customer attrition rate and discount rate. |
• | We assessed the reasonableness of management’s forecasts and assumptions related to the revenue growth rate by comparing projections to historical results and certain peer company data. |
• | We tested the source information underlying the determination of the customer attrition rate and testing the mathematical accuracy of the calculation. |
• | Our fair value specialists assisted us in considering the reasonableness of the (1) valuation methodology and (2) the discount rate by: |
• | Testing the source information underlying the determination of the discount rate and testing the mathematical accuracy of the calculation. |
• | Developing a range of independent estimates and comparing those to the discount rate selected by management. |
• | We evaluated whether the projected revenue growth rates were consistent with evidence obtained in other areas of the audit. |
Revenue Recognition - Issuer Solutions - Refer to Notes 1 and 3 to the financial statements
Critical Audit Matter Description
The Company enters into long-term revenue contracts with its Issuer Solutions customers. Issuer Solutions customer contracts may include multiple promises including processing services, loyalty redemption services and professional services to financial institutions and other financial services providers. The Company has determined that the processing services and loyalty redemption services represent stand-ready performance obligations comprising a series of distinct days of services that are substantially the same and have the same pattern of transfer to the customer. These performance obligations include variable consideration. The Company determined that (a) the variable consideration relates specifically to its efforts to satisfy the performance obligation and (b) allocating the variable amount of consideration entirely to the performance obligation is consistent with the allocation objective when considering all of the performance obligations and payment terms in the contract. As a result, the Company recognizes variable consideration in the period in which it has the contractual right to invoice the customer. Professional services representing performance obligations are satisfied over time.
We identified the determination of performance obligations for Issuer Solutions revenue contracts as a critical audit matter, given the judgment required to determine whether promised services are capable of being distinct and are distinct within the context of the contract. A high degree of auditor judgment was required to evaluate the Company's identification of the performance obligations in the contract.
47
How the Critical Audit Matter Was Addressed in the Audit
Our audit procedures related to the Company's Issuer Solutions revenue transactions, specifically its identification of the performance obligations in contracts with its customers:
• | We evaluated the effectiveness of controls over Issuer Solutions contract revenue, including controls over the identification of performance obligations. |
• | We selected a sample of Issuer Solutions contracts and performed the following: |
• | Evaluated whether the performance obligations were appropriately identified in each of the selected contracts. |
• | Evaluated whether the pattern of revenue recognition was correctly determined for each of the identified performance obligations. |
Revenues -Merchant Solutions - Refer to Note 1 to the financial statements
Critical Audit Matter Description
The Company's Merchant Solutions revenue from payment services consists of transaction-based fees made up of a significant volume of low-dollar transactions, sourced from multiple systems and applications. The processing of transactions and recording of revenue is highly automated and is based on contractual terms with merchants, financial institutions, payment networks, and other parties.
Accordingly, we identified Merchant Solutions revenue as a critical audit matter. This required an increased extent of effort, including the need for us to involve professionals with expertise in information technology (IT), to identify, test, and evaluate the Company's systems, software applications, and automated controls.
How the Critical Audit Matter Was Addressed in the Audit
Our audit procedures related to the Company's systems to process Merchant Solutions payment services revenues included the following, among others:
• | With the assistance of our IT specialists, we: |
• | Identified the significant systems used to process revenue transactions and tested the general IT controls over each of these systems, including testing of user access controls, change management controls, and IT operations controls. |
• | Tested system interface controls and automated controls within the relevant revenue streams, as well as the controls designed to ensure the accuracy and completeness of revenue. |
• | We tested internal controls within the relevant revenue business processes, including those in place to reconcile the various reports extracted from the IT systems to the Company’s general ledger. |
• | We evaluated trends in recorded revenue, including interchange fees and payment network fees. |
• | For a sample of revenue transactions, we tested selected transactions by agreeing the amounts of revenue recognized to source documents and testing the mathematical accuracy of the recorded revenue. |
/s/ DELOITTE & TOUCHE LLP
Atlanta, Georgia
February 21, 2020
We have served as the Company's auditors since 2002.
48
GLOBAL PAYMENTS INC.
CONSOLIDATED STATEMENTS OF INCOME
(in thousands, except per share data)
Years Ended December 31, | |||||||||||
2019 | 2018 | 2017 | |||||||||
Revenues | $ | $ | $ | ||||||||
Operating expenses: | |||||||||||
Cost of service | |||||||||||
Selling, general and administrative | |||||||||||
Operating income | |||||||||||
Interest and other income | |||||||||||
Interest and other expense | ( | ) | ( | ) | ( | ) | |||||
( | ) | ( | ) | ( | ) | ||||||
Income before income taxes and equity in income of equity method investments | |||||||||||
Income tax (expense) benefit | ( | ) | ( | ) | |||||||
Income before equity in income of equity method investments | |||||||||||
Equity in income of equity method investments, net of tax | |||||||||||
Net income | |||||||||||
Less: Net income attributable to noncontrolling interests | ( | ) | ( | ) | ( | ) | |||||
Net income attributable to Global Payments | $ | $ | $ | ||||||||
Earnings per share attributable to Global Payments: | |||||||||||
Basic earnings per share | $ | $ | $ | ||||||||
Diluted earnings per share | $ | $ | $ | ||||||||
See Notes to Consolidated Financial Statements.
49
GLOBAL PAYMENTS INC.
CONSOLIDATED STATEMENTS OF COMPREHENSIVE INCOME
(in thousands)
Years Ended December 31, | |||||||||||
2019 | 2018 | 2017 | |||||||||
Net income | $ | $ | $ | ||||||||
Other comprehensive income (loss): | |||||||||||
Foreign currency translation adjustments | ( | ) | |||||||||
Income tax benefit (expense) related to foreign currency translation adjustments | ( | ) | |||||||||
Net unrealized (losses) gains on hedging activities | ( | ) | ( | ) | |||||||
Reclassification of net unrealized losses (gains) on hedging activities to interest expense | ( | ) | |||||||||
Income tax benefit (expense) related to hedging activities | ( | ) | |||||||||
Other, net of tax | ( | ) | |||||||||
Other comprehensive income (loss) | ( | ) | ( | ) | |||||||
Comprehensive income | |||||||||||
Less: comprehensive income attributable to noncontrolling interests | ( | ) | ( | ) | ( | ) | |||||
Comprehensive income attributable to Global Payments | $ | $ | $ | ||||||||
See Notes to Consolidated Financial Statements.
50
GLOBAL PAYMENTS INC.
CONSOLIDATED BALANCE SHEETS
(in thousands, except share data)
December 31, 2019 | December 31, 2018 | ||||||
ASSETS | |||||||
Current assets: | |||||||
Cash and cash equivalents | $ | $ | |||||
Accounts receivable, net | |||||||
Settlement processing assets | |||||||
Prepaid expenses and other current assets | |||||||
Total current assets | |||||||
Goodwill | |||||||
Other intangible assets, net | |||||||
Property and equipment, net | |||||||
Deferred income taxes | |||||||
Other noncurrent assets | |||||||
Total assets | $ | $ | |||||
LIABILITIES AND EQUITY | |||||||
Current liabilities: | |||||||
Settlement lines of credit | $ | $ | |||||
Current portion of long-term debt | |||||||
Accounts payable and accrued liabilities | |||||||
Settlement processing obligations | |||||||
Total current liabilities | |||||||
Long-term debt | |||||||
Deferred income taxes | |||||||
Other noncurrent liabilities | |||||||
Total liabilities | |||||||
Commitments and contingencies | |||||||
Equity: | |||||||
Preferred stock, no par value; 5,000,000 shares authorized and none issued | |||||||
Common stock, no par value; 400,000,000 shares authorized at December 31, 2019 and 200,000,000 shares authorized at December 31, 2018; 300,225,590 shares issued and outstanding at December 31, 2019 and 157,961,982 shares issued and outstanding at December 31, 2018 | |||||||
Paid-in capital | |||||||
Retained earnings | |||||||
Accumulated other comprehensive loss | ( | ) | ( | ) | |||
Total Global Payments shareholders’ equity | |||||||
Noncontrolling interests | |||||||
Total equity | |||||||
Total liabilities and equity | $ | $ | |||||
See Notes to Consolidated Financial Statements.
51
GLOBAL PAYMENTS INC.
CONSOLIDATED STATEMENTS OF CASH FLOWS
(in thousands)
Years Ended December 31, | |||||||||||
2019 | 2018 | 2017 | |||||||||
Cash flows from operating activities: | |||||||||||
Net income | $ | $ | $ | ||||||||
Adjustments to reconcile net income to net cash provided by operating activities: | |||||||||||
Depreciation and amortization of property and equipment | |||||||||||
Amortization of acquired intangibles | |||||||||||
Amortization of capitalized contract costs | |||||||||||
Share-based compensation expense | |||||||||||
Provision for operating losses and bad debts | |||||||||||
Noncash lease expense | |||||||||||
Deferred income taxes | ( | ) | ( | ) | ( | ) | |||||
Other, net | ( | ) | ( | ) | |||||||
Changes in operating assets and liabilities, net of the effects of business combinations: | |||||||||||
Accounts receivable | ( | ) | ( | ) | ( | ) | |||||
Settlement processing assets and obligations, net | ( | ) | |||||||||
Prepaid expenses and other assets | ( | ) | ( | ) | ( | ) | |||||
Accounts payable and other liabilities | ( | ) | |||||||||
Net cash provided by operating activities | |||||||||||
Cash flows from investing activities: | |||||||||||
Acquisitions, net of cash acquired | ( | ) | ( | ) | ( | ) | |||||
Capital expenditures | ( | ) | ( | ) | ( | ) | |||||
Proceeds from sale-and-leaseback transaction | |||||||||||
Other, net | ( | ) | ( | ) | |||||||
Net cash used in investing activities | ( | ) | ( | ) | ( | ) | |||||
Cash flows from financing activities: | |||||||||||
Net (repayments of) borrowings from settlement lines of credit | ( | ) | |||||||||
Proceeds from long-term debt | |||||||||||
Repayments of long-term debt | ( | ) | ( | ) | ( | ) | |||||
Payments of debt issuance costs | ( | ) | ( | ) | ( | ) | |||||
Repurchases of common stock | ( | ) | ( | ) | ( | ) | |||||
Proceeds from stock issued under share-based compensation plans | |||||||||||
Common stock repurchased - share-based compensation plans | ( | ) | ( | ) | ( | ) | |||||
Distributions to noncontrolling interests | ( | ) | ( | ) | ( | ) | |||||
Preacquisition dividends paid to former TSYS shareholders | ( | ) | |||||||||
Dividends paid | ( | ) | ( | ) | ( | ) | |||||
Net cash (used in) provided by financing activities | ( | ) | |||||||||
Effect of exchange rate changes on cash | ( | ) | |||||||||
Increase (decrease) in cash and cash equivalents | ( | ) | |||||||||
Cash and cash equivalents, beginning of the period | |||||||||||
Cash and cash equivalents, end of the period | $ | $ | $ | ||||||||
See Notes to Consolidated Financial Statements.
52
GLOBAL PAYMENTS INC.
CONSOLIDATED STATEMENTS OF CHANGES IN EQUITY
(in thousands, except per share data)
Number of Shares | Paid-in Capital | Retained Earnings | Accumulated Other Comprehensive Loss | Total Global Payments Shareholders’ Equity | Noncontrolling Interests | Total Equity | ||||||||||||||||||||
Balance at December 31, 2018 | $ | $ | $ | ( | ) | $ | $ | $ | ||||||||||||||||||
Net income | ||||||||||||||||||||||||||
Other comprehensive loss | ( | ) | ( | ) | ( | ) | ( | ) | ||||||||||||||||||
Stock issued under share-based compensation plans | ||||||||||||||||||||||||||
Common stock repurchased - share-based compensation plans | ( | ) | ( | ) | ( | ) | ( | ) | ||||||||||||||||||
Share-based compensation expense | ||||||||||||||||||||||||||
Issuance of common stock in connection with a business combination | ||||||||||||||||||||||||||
Distributions to noncontrolling interests | ( | ) | ( | ) | ||||||||||||||||||||||
Repurchases of common stock | ( | ) | ( | ) | ( | ) | ( | ) | ( | ) | ||||||||||||||||
Cash dividends declared ($0.225 per common share) | ( | ) | ( | ) | ( | ) | ||||||||||||||||||||
Balance at December 31, 2019 | $ | $ | $ | ( | ) | $ | $ | $ | ||||||||||||||||||
Number of Shares | Paid-in Capital | Retained Earnings | Accumulated Other Comprehensive Loss | Total Global Payments Shareholders’ Equity | Noncontrolling Interests | Total Equity | ||||||||||||||||||||
Balance at December 31, 2017 | $ | $ | $ | ( | ) | $ | $ | $ | ||||||||||||||||||
Cumulative effect of adoption of new accounting standards | ( | ) | ||||||||||||||||||||||||
Net income | ||||||||||||||||||||||||||
Other comprehensive loss | ( | ) | ( | ) | ( | ) | ( | ) | ||||||||||||||||||
Stock issued under share-based compensation plans | ||||||||||||||||||||||||||
Common stock repurchased - share-based compensation plans | ( | ) | ( | ) | ( | ) | ( | ) | ||||||||||||||||||
Share-based compensation expense | ||||||||||||||||||||||||||
Distributions to noncontrolling interests | ( | ) | ( | ) | ||||||||||||||||||||||
Repurchases of common stock | ( | ) | ( | ) | ( | ) | ( | ) | ( | ) | ||||||||||||||||
Cash dividends declared ($0.04 per common share) | ( | ) | ( | ) | ( | ) | ||||||||||||||||||||
Balance at December 31, 2018 | $ | $ | $ | ( | ) | $ | $ | $ | ||||||||||||||||||
See Notes to Consolidated Financial Statements.
53
GLOBAL PAYMENTS INC.
CONSOLIDATED STATEMENTS OF CHANGES IN EQUITY
(in thousands, except per share data)
Number of Shares | Paid-in Capital | Retained Earnings | Accumulated Other Comprehensive Loss | Total Global Payments Shareholders’ Equity | Noncontrolling Interests | Total Equity | ||||||||||||||||||||
Balance at December 31, 2016 | $ | $ | $ | ( | ) | $ | $ | $ | ||||||||||||||||||
Net income | ||||||||||||||||||||||||||
Other comprehensive income | ||||||||||||||||||||||||||
Stock issued under share-based compensation plans | ||||||||||||||||||||||||||
Common stock repurchased - share-based compensation plans | ( | ) | ( | ) | ( | ) | ( | ) | ||||||||||||||||||
Share-based compensation expense | ||||||||||||||||||||||||||
Issuance of common stock in connection with a business combination | ||||||||||||||||||||||||||
Dissolution of a subsidiary | ( | ) | ||||||||||||||||||||||||
Distributions to noncontrolling interests | ( | ) | ( | ) | ||||||||||||||||||||||
Repurchases of common stock | ( | ) | ( | ) | ( | ) | ( | ) | ( | ) | ||||||||||||||||
Cash dividends declared ($0.04 per common share) | ( | ) | ( | ) | ( | ) | ||||||||||||||||||||
Balance at December 31, 2017 | $ | $ | $ | ( | ) | $ | $ | $ | ||||||||||||||||||
See Notes to Consolidated Financial Statements.
54
NOTES TO CONSOLIDATED FINANCIAL STATEMENTS
NOTE 1—BASIS OF PRESENTATION AND SUMMARY OF SIGNIFICANT ACCOUNTING POLICIES
Business, consolidation and presentation— We are a leading pure play payments technology company delivering innovative software and services to our customers globally. Our technologies, services and employee expertise enable us to provide a broad range of solutions that allow our customers to operate their businesses more efficiently across a variety of channels around the world. We operate in three reportable segments: Merchant Solutions, Issuer Solutions and Business and Consumer Solutions, which are described in "Note 15—Segment Information." Global Payments Inc. and its consolidated subsidiaries are referred to collectively as "Global Payments," the "Company," "we," "our" or "us," unless the context requires otherwise.
On September 18, 2019, we consummated our merger with Total System Services, Inc. ("TSYS") (the "Merger") for total purchase consideration of $24.5 billion, primarily funded with shares of our common stock. Prior to the Merger, TSYS was a leading global payments provider, offering seamless, secure and innovative solutions to issuers, merchants and consumers. See "Note 2—Acquisitions" for further discussion of the Merger and other acquisitions.
These consolidated financial statements include our accounts and those of our majority-owned subsidiaries and all intercompany balances and transactions have been eliminated in consolidation. Investments in entities that we do not control are accounted for using the equity or cost method, depending upon our ability to exercise significant influence over operating and financial policies. These consolidated financial statements have been prepared in accordance with accounting principles generally accepted in the United States ("GAAP").
Use of estimates— The preparation of financial statements in conformity with GAAP requires management to make certain estimates and assumptions that affect the reported amounts of assets and liabilities and disclosures of contingent assets and liabilities at the date of the financial statements, as well as the reported amounts of revenues and expenses during the reported period. Actual results could differ materially from those estimates.
Recently adopted accounting pronouncements— The Financial Accounting Standards Board ("FASB") issued Accounting Standards Update ("ASU") 2016-02, "Leases", which requires recognition of assets and liabilities for the rights and obligations created by leases and new disclosures about leases. We adopted ASU 2016-02, as well as other related clarifications and interpretive guidance issued by the FASB, on January 1, 2019 using the modified retrospective transition method. Under this transition method, we did not recast the prior period financial statements presented. We elected the transition package of three practical expedients, which among other things, allowed for the carryforward of historical lease classifications. We made an accounting policy election to not recognize assets or liabilities for leases with a term of less than 12 months and to account for all components in a lease arrangement as a single combined lease component for all of our then existing asset classes. In connection with the Merger, we acquired right-of-use assets that represent an additional asset class for computer equipment, for which we account for lease and nonlease components separately.
The adoption of ASU 2016-02 resulted in the measurement and recognition of lease liabilities in the amount of $274.0 million and right-of-use assets in the amount of $236.0 million as of January 1, 2019. Lease liabilities were measured as the present value of remaining lease payments, and the corresponding right-of-use assets were measured at an amount equal to the lease liabilities adjusted by the amounts of certain assets and liabilities, such as prepaid rent and deferred lease obligations, that we previously recognized on the balance sheet prior to the initial application of ASU 2016-02. To calculate the present value of remaining lease payments, we elected to use an incremental borrowing rate based on the remaining lease term at transition.
We adopted ASU 2014-09, "Revenues from Contracts with Customers (Topic 606)" as well as other clarifications and technical guidance issued by the FASB related to this new revenue standard ("ASC 606") and ASC Subtopic 340-40: "Other Assets and Deferred Costs - Contracts with Customers" ("ASC 340-40") on January 1, 2018. We elected the modified retrospective transition method, which resulted in a net increase to retained earnings of $51.0 million for the cumulative effect of applying the standard. The primary components of the cumulative-effect adjustment were changes in the accounting for certain costs to obtain customer contracts and the related income tax effects, which resulted in increases to other noncurrent assets and deferred income tax liabilities of $64.6 million and $15.6 million, respectively. Previously, we amortized these assets to expense over the related contract term. Under ASC 340-40, we now amortize these assets over the expected period of benefit, which is generally longer than the initial contract term. Under the new standard, we also capitalized certain costs that were not previously capitalized,
55
including certain commissions and the related payroll taxes and certain costs incurred to fulfill a contract before the performance obligation has been satisfied, primarily compensation and related payroll taxes for employees engaged in customer implementation activities in our technology-enabled businesses.
Prior to the adoption of ASC 606, we presented payments made to certain third parties, including payment networks, as a component of operating expenses. For periods beginning on and after January 1, 2018, we present revenue net of these third-party payments. This change in presentation had the effect of reducing our revenues and operating expenses by the same amounts. As a result, revenues, cost of service and selling, general and administrative expenses were lower than the amounts that would have been presented if not for the effect of the new revenue accounting standard by $1,110.8 million, $1,042.9 million and $67.9 million, respectively, for the year ended December 31, 2018. The adoption of ASC 606 did not have a material effect on any other line items in our consolidated statement of income for year ended December 31, 2018 or on any other line items in our consolidated balance sheet as of December 31, 2018 and had no effect on our cash flows from operating activities, investing activities or financing activities included in our consolidated statement of cash flows for the year ended December 31, 2018.
Revenue recognition— Pursuant to ASC 606, at contract inception, we assess the goods and services promised in our contracts with customers and identify a performance obligation for each promise to transfer to the customer a good or service that is distinct. In accordance with ASC 606, we recognize revenue when a customer obtains control of promised services. The amount of revenue recognized reflects the consideration to which we expect to be entitled to receive in exchange for these services.
Merchant Solutions. Our customers in the Merchant Solutions segment contract with us for payment services, which we provide in exchange for consideration for completed transactions. Our payment solutions are similar around the world in that we enable our customers to accept card, electronic, check and digital-based payments. Our comprehensive offerings include, but are not limited to, authorization services, settlement and funding services, customer support and help-desk functions, chargeback resolution, payment security services, consolidated billing and statements and on-line reporting. In addition, we may sell or rent point-of-sale terminals or other equipment to customers.
For our payment services obligation, the nature of our promise to the customer is that we stand ready to process transactions the customer requests on a daily basis over the contract term. Since the timing and quantity of transactions to be processed by us is not determinable, we view payment services to comprise an obligation to stand ready to process as many transactions as the customer requests. Under a stand-ready obligation, the evaluation of the nature of our performance obligation is focused on each time increment rather than the underlying activities. Therefore, we view payment services to comprise a series of distinct days of service that are substantially the same and have the same pattern of transfer to the customer. Accordingly, the promise to stand ready is accounted for as a single-series performance obligation.
In order to provide our payment services, we route and clear each transaction through the applicable payment network. We obtain authorization for the transaction and request funds settlement from the card issuing financial institution through the payment network. When third parties are involved in the transfer of goods or services to our customer, we consider the nature of each specific promised good or service and apply judgment to determine whether we control the good or service before it is transferred to the customer or whether we are acting as an agent of the third party. To determine whether or not we control the good or service before it is transferred to the customer, we assess indicators including which party is primarily responsible for fulfillment and has discretion in determining pricing for the good or service, as well as other considerations. Based on our assessment of these indicators, we have concluded that our promise to our customer to provide our payment services is distinct from the services provided by the card issuing financial institutions and payment networks in connection with payment transactions. We do not have the ability to direct the use of and obtain substantially all of the benefits of the services provided by the card issuing financial institutions and payment networks before those services are transferred to our customer, and on that basis, we do not control those services prior to being transferred to our customer. As a result, upon adoption of ASC 606, we present our revenues net of the interchange fees retained by the card issuing financial institutions and the fees charged by the payment networks.
The majority of our payment services are priced as a percentage of transaction value or a specified fee per transaction, depending on the card type. We also charge other per occurrence fees based on specific services that may be unrelated to the number of transactions or transaction value. Given the nature of the promise and the underlying fees based on unknown quantities or outcomes of services to be performed over the contract term, the total consideration is determined to be variable consideration. The variable consideration for our payment service is usage-based and, therefore, it specifically relates to our efforts to satisfy our payment services obligation. The variability is satisfied each day the service is provided to the customer. We directly ascribe variable fees to the distinct day of service to which it relates, and we consider the services performed each day in order to ascribe
56
the appropriate amount of total fees to that day. Therefore, we measure revenues for our payment service on a daily basis based on the services that are performed on that day.
Certain of our technology-enabled customer arrangements contain multiple promises, such as payment services, perpetual software licenses, software-as-a-service ("SaaS"), maintenance, installation services, training and equipment, each of which is evaluated to determine whether it represents a separate performance obligation. SaaS arrangements are generally offered on a subscription basis, providing the customers with access to the SaaS platform along with general support and maintenance services. Because these promised services within our SaaS arrangements are delivered concurrently over the contract term, we account for these promises as if they are a single performance obligation that includes a series of distinct services with the same pattern of transfer to the customer. In addition, certain installation services are not considered distinct from the SaaS and are recognized over the expected period of benefit.
Once we determine the performance obligations and the transaction price, including an estimate of any variable consideration, we then allocate the transaction price to each performance obligation in the contract using a relative standalone selling price method. We determine standalone selling price based on the price at which the good or service is sold separately. If the standalone selling price is not observable through past transactions, we estimate the standalone selling price by considering all reasonably available information, including market conditions, trends or other company- or customer-specific factors. Substantially all of the performance obligations described above are satisfied over time. The performance obligations associated with equipment sales, perpetual software licenses and certain professional services are generally satisfied at a point in time when they are transferred to the customer. For certain other professional services that represent separate performance obligations, we generally use the input method and recognize revenue based on the number of hours incurred or services performed to date in relation to the total services expected to be required to satisfy the performance obligation.
We satisfy the combined SaaS performance obligation by standing ready to provide access to the SaaS. Consideration for SaaS arrangements may consist of fixed or usage-based fees. Revenue is recognized over the period for which the services are provided or by directly ascribing any variable fees to the distinct day of service based on the services that are performed on that day.
Issuer Solutions. Issuer Solutions segment revenues are derived from long-term contracts with financial institutions and other financial service providers. Issuer Solutions customer contracts may include multiple promises. Payment processing services revenues are generated primarily from charges based on the number of accounts on file, transactions and authorizations processed, statements generated and/or mailed, managed services, cards embossed and mailed, and other processing services for cardholders accounts on file. Most of these contracts have prescribed annual minimums, penalties for early termination, and service level agreements that may affect contractual fees if specific service levels are not achieved. Issuer Solutions revenues also include loyalty redemption services and professional services. To the extent a contract includes multiple promised services, we must apply judgment to determine whether promised services are capable of being distinct and are distinct in the context of the contract. If these criteria are not met, the promised services are combined and accounted for as a single performance obligation.
Issuer Solutions customer contracts typically include an obligation to provide processing services to financial institutions and other financial services providers. We have determined that these processing services represent a stand-ready obligation comprising a series of distinct days of services that are substantially the same and have the same pattern of transfer to the customer. In many cases, Issuer Solutions arrangements may include additional performance obligations relating to loyalty redemption services and other professional services. Similar to processing services, we have determined that loyalty redemption services represent a stand-ready obligation comprising a series of distinct days of service that are substantially the same and have the same pattern of transfer to the customer.
The performance obligations to provide processing services and loyalty redemption services include variable consideration. With respect to these performance obligations, we have determined that (a) the variable consideration relates specifically to our efforts to satisfy the performance obligation and (b) allocating the variable amount of consideration entirely to the performance obligation is consistent with the allocation objective when considering all of the performance obligations and payment terms in the contract. As a result, we allocate and recognize variable consideration in the period in which we have the contractual right to invoice the customer.
Professional services representing performance obligations are satisfied over time. For professional services, we recognize revenue based on the labor hours incurred for time and materials projects or on a straight-line basis for fixed-fee projects.
57
In some cases, we pay certain of our customers a signing incentive at contract inception or renewal. Consideration paid to customers is accounted for as a reduction of the transaction price and recognized as a reduction in revenues as the related services are transferred to the customer over the contract term. The deferred portion of consideration paid to customers is classified within other assets in our consolidated balance sheets.
Business and Consumer Solutions. Business and Consumer Solutions segment revenues principally consist of fees collected from cardholders and fees generated by cardholder activity in connection with the programs that we manage. Customers are typically charged a fee for each purchase transaction made using their cards, unless the customer is on a monthly or annual service plan, in which case the customer is instead charged a monthly or annual subscription fee, as applicable. Customers are also charged a monthly maintenance fee after a specified period of inactivity. We also charge fees associated with additional services offered in connection with our accounts, including the use of overdraft features, a variety of bill payment options, card replacement, foreign exchange and card-to-card transfers of funds initiated through our call centers.
Business and Consumer Solutions revenues include a stand-ready performance obligation to provide account access and facilitate purchase transactions. We have determined that we have a right to consideration from a customer in an amount that corresponds directly with the value to the customer of our performance completed to date. As a result, we recognize revenue in the amount to which we have a right to invoice. Revenues are recognized net of fees charged by the payment networks for services they provide in processing transactions routed through them.
Revenue recognition prior to ASC 606. For periods prior to our adoption of ASC 606, we recognized revenue when services were performed. For arrangements with multiple elements, such as equipment, perpetual licenses, SaaS, maintenance, installation and training, we allocated consideration to each element based on the relative-selling-price method. In multiple element arrangements where more-than-incidental software elements were included, the entire amount of revenue under the arrangement was deferred until all elements were delivered or objective evidence of the fair value of the undelivered items was established.
Cash and cash equivalents— Cash and cash equivalents include cash on hand and all liquid investments with a maturity of three months or less when purchased. We consider certain portions of our cash and cash equivalents to be unrestricted but not available for general purposes. The amount of cash that we consider to be available for general purposes does not include the following: (i) settlement-related cash balances, (ii) funds held as collateral for merchant losses ("Merchant Reserves") and (iii) funds held for customers. Settlement-related cash balances represent funds that we hold when the incoming amount from the card networks precedes the funding obligation to the merchant. Settlement-related cash balances are not restricted; however, these funds are generally paid out in satisfaction of settlement processing obligations the following day. Merchant Reserves serve as collateral to minimize contingent liabilities associated with any losses that may occur under the merchant agreement. We record a corresponding liability in settlement processing assets and settlement processing obligations in our consolidated balance sheet. While this cash is not restricted in its use, we believe that designating this cash as Merchant Reserves strengthens our fiduciary standing with financial institutions that sponsor us and is in accordance with guidelines set by the card networks. Funds held for customers and the corresponding liability that we record in "customer deposits" include amounts collected prior to remittance on our customers' behalf.
Accounts receivable, contract assets and contract liabilities— A contract with a customer creates legal rights and obligations. As we perform under customer contracts, our right to consideration that is unconditional is considered to be accounts receivable. If our right to consideration for such performance is contingent upon a future event or satisfaction of additional performance obligations, the amount of revenues we have recognized in excess of the amount we have billed to the customer is recognized as a contract asset. Contract liabilities represent consideration received from customers in excess of revenues recognized. Contract assets and liabilities are presented net at the individual contract level in the consolidated balance sheet and are classified as current or noncurrent based on the nature of the underlying contractual rights and obligations.
Allowance for doubtful accounts— Accounts receivable balances are stated net of an allowance for doubtful accounts and billing adjustments. We record an allowance for doubtful accounts when it is probable that the accounts receivable balance will not be collected. Increases in the allowance for doubtful accounts are recorded as charges to bad debt expense and are reflected in selling, general and administrative expenses in our consolidated statements of income. Write-offs of uncollectible accounts are charged against the allowance for doubtful accounts. We record an allowance for billing adjustments for actual and potential billing discrepancies. Increases in the allowance for billing adjustments are recorded as a reduction of revenues in our consolidated statements of income and actual adjustments to invoices are charged against the allowance for billing adjustments.
58
Contract costs— Upon adoption of ASC 340-40, we capitalize costs to obtain contracts with customers, including employee sales commissions and fees to business partners. At contract inception, we capitalize such costs that we expect to recover and that would not have been incurred if the contract had not been obtained. In certain cases where costs related to obtaining customers are incurred after the inception of the customer contract, such costs are capitalized as the corresponding liability is recognized. We also capitalize certain costs incurred to fulfill our contracts with customers that (i) relate directly to the contract, (ii) are expected to generate resources that will be used to satisfy our performance obligation under the contract and (iii) are expected to be recovered through revenues generated under the contract. Capitalized costs to obtain and to fulfill contracts are included in other noncurrent assets.
Contract costs are amortized to operating expense in our consolidated statements of income on a systematic basis consistent with the transfer to the customer of the goods or services to which the asset relates. Amortization of capitalized costs to obtain customer contracts is included in selling, general and administrative expenses, while amortization of capitalized costs to fulfill customer contracts is included in cost of services. We utilize a straight-line or proportional amortization method depending upon which method best depicts the pattern of transfer of the goods or services to the customer. We amortize these assets over the expected period of benefit, which, based on the factors noted above, is typically three to seven years. In order to determine the appropriate amortization period for capitalized contract costs, we consider a combination of factors, including customer attrition rates, estimated terms of customer relationships, the useful lives of technology we use to provide goods and services to our customers, whether future contract renewals are expected and if there is any incremental commission to be paid associated with a contract renewal. Costs to obtain a contract with an expected period of benefit of one year or less are recognized as an expense when incurred. We evaluate contract costs for impairment by comparing, on a pooled basis, the expected future net cash flows from underlying customer relationships to the carrying amount of the capitalized contract costs.
Prior to our adoption of ASC 606, we capitalized certain customer acquisition costs that represented incremental, direct costs that were recoverable through merchant profitability. The capitalized customer acquisition costs were amortized using a proportional method over the initial term of the related merchant contract. The deferred customer acquisition cost asset was accrued over the first year of merchant processing, consistent with the build-up in the accrued buyout liability, as described below.
Up-front distributor and partner payments— We make up-front contractual payments to third-party distributors and partners that do not meet the criteria of a contract cost. If the payments meet the criteria to be recognized as an asset, we capitalize the up-front payment and recognize the capitalized amount as expense ratably over the period of benefit, which is generally the contract period. If the contract requires the distributor or partner to perform specific acts and no other conditions exist for the distributor or partner to earn or retain the up-front payment, then we recognize the capitalized amount as an expense when the performance conditions have been met. Up-front distributor and partner payments are classified on our consolidated balance sheet within prepaid expenses and other current assets and other noncurrent assets and the related expense is recorded within selling, general and administrative expenses in our consolidated statements of income.
Settlement processing assets and obligations — Funds settlement refers to the process of transferring funds for sales and credits between card issuers and merchants and relates to certain transactions processed in our Merchant Solutions segment. For transactions processed on our systems, we use our internal network to provide funding instructions to financial institutions that in turn fund the merchants. We process funds settlement under two models, a sponsorship model and a direct membership model.
Under the sponsorship model, we are designated as an independent sales organization by Mastercard and Visa, which means that member clearing banks ("Member") sponsor us and require our adherence to the standards of the payment networks. In certain markets, we have sponsorship or depository and clearing agreements with financial institution sponsors. These agreements allow us to route transactions under the Members' control and identification numbers to clear credit card transactions through Mastercard and Visa. In this model, the standards of the payment networks restrict us from performing funds settlement or accessing merchant settlement funds, and, instead, require that these funds be in the possession of the Member until the merchant is funded.
Under the direct membership model, we are members in various payment networks, allowing us to process and fund transactions without third-party sponsorship. In this model, we route and clear transactions directly through the card brand’s network and are not restricted from performing funds settlement. Otherwise, we process these transactions similarly to how we process transactions in the sponsorship model. We are required to adhere to the standards of the payment networks in which we are direct members. We maintain relationships with financial institutions, which may also serve as our Member sponsors for other card brands or in other markets, to assist with funds settlement.
59
Timing differences, interchange fees, merchant reserves and exception items cause differences between the amount received from the payment networks and the amount funded to the merchants. These intermediary balances arising in our settlement process are reflected as settlement processing assets and obligations on our consolidated balance sheets.
Settlement processing assets and obligations include the following components:
• | Interchange reimbursement. Our receivable from merchants for the portion of the discount fee related to reimbursement of the interchange fee. |
• | Receivable from Members. Our receivable from the Members for transactions in which we have advanced funding to the Members to fund merchants in advance of receipt of funding from networks. |
• | Receivable from networks. Our receivable from a payment network for transactions processed on behalf of merchants where we are a direct member of that particular network. |
• | Exception items. Items such as customer chargeback amounts received from merchants. |
• | Merchant Reserves. Reserves held to minimize contingent liabilities associated with losses that may occur under the merchant agreement. |
• | Liability to Members. Our liability to the Members for transactions for which funding from the payment network has been received by the Members but merchants have not yet been funded. |
• | Liability to merchants. Our liability to merchants for transactions that have been processed but not yet funded where we are a direct member of a particular payment network. |
• | Reserve for merchant losses and sales allowances. Our reserve for allowances, charges or losses that we do not expect to collect from the merchants due to concessions, merchant fraud, insolvency, bankruptcy or any other merchant-related reason. |
We apply offsetting to our settlement processing assets and obligations where a right of setoff exists. In the sponsorship model, we apply offsetting by Member agreement because the Member is ultimately responsible for funds settlement. With these Member transactions, we do not have access to the gross proceeds of the receivable from the payment networks and, thus, do not have a direct obligation or any ability to satisfy the payable to fund the merchant. In these situations, we apply offsetting to determine a net position for each Member agreement. If that net position is an asset, we reflect the net amount in settlement processing assets on our consolidated balance sheet. If that net position is a liability, we reflect the net amount in settlement processing obligations on our consolidated balance sheet. In the direct membership model, offsetting is not applied, and the individual components are presented as an asset or obligation based on the nature of that component.
Reserve for merchant losses and sales allowances— Our merchant customers are liable for any charges or losses that occur under the merchant agreement. We experience losses in our card processing services when we are unable to collect amounts from merchant customers for any charges properly reversed by the card issuing financial institutions. When we are not able to collect these amounts from the merchants due to merchant fraud, insolvency, bankruptcy or any other reason, we may be liable for the reversed charges. We require cash deposits, guarantees, letters of credit and other types of collateral from certain merchants to minimize any such contingent liability, and we also utilize a number of systems and procedures to manage merchant risk. We record an estimated liability for merchant losses comprised of estimated known losses and estimated incurred but not reported losses, which is included in settlement processing obligations in our consolidated balance sheet. The provision for merchant losses is included as a component of cost of service and the sales allowance provision is included as a reduction of revenue in our consolidated statements of income..
Reserve for check guarantee operating losses— We experience check guarantee losses when we are unable to collect the full amount of a guaranteed check from the checkwriter. In our check guarantee service offering, we charge our merchants a percentage of the gross amount of the check and guarantee payment of the check to the merchant in the event the check is not honored by the checkwriter's bank. We have the right to collect the full amount of the check from the checkwriter, but have not historically always recovered 100% of the guaranteed checks. We record a reserve for estimated losses on returned checks and estimated incurred but not reported losses, which is presented as a valuation allowance against claims receivable included in prepaid expenses and other current assets in the consolidated balance sheets. The provision for check guarantee losses is included as a component of cost of service in the consolidated statements of income.
Reserve for contract contingencies and processing errors— A significant number of our customer contracts in our Issuer Solutions segment contain service level agreements that can result in performance penalties payable by us if we do not meet
60
contractually required service levels. We record an accrual for estimated performance penalties and processing errors. When providing for these accruals, we consider such factors as our history of incurring performance penalties and processing errors, actual contractual penalty charge rates in our contracts, progress towards milestones and known processing errors. These accruals are included in accounts payable and accrued liabilities in our consolidated balance sheet. Depending on the nature of item, transaction processing provisions are included as a reduction of the transaction price and recognized as a reduction in revenues as the related services are transferred to the customer, or as a component of cost of service, in our consolidated statements of income.
Reserve for cardholder losses— Through services offered in our Business and Consumer Solutions segment, we are exposed to losses due to cardholder fraud, payment defaults and other forms of cardholder activity as well as losses due to nonperformance of third parties who receive cardholder funds for transmittal to the issuing financial institutions. We establish a reserve for losses we estimate will arise from processing customer transactions, debit card overdrafts, chargebacks for unauthorized card use and merchant-related chargebacks due to nondelivery of goods and services. These reserves are established based upon historical loss and recovery rates and cardholder activity for which specific losses can be identified. These reserves are included in accounts payable and accrued liabilities in our consolidated balance sheet, and the provision for cardholder losses is included as a component of cost of service in our consolidated statements of income.
Property and equipment— Property and equipment are stated at cost less accumulated depreciation and amortization. Depreciation and amortization are generally calculated using the straight-line method. Leasehold improvements are amortized over the lesser of the remaining term of the lease and the useful life of the asset.
We develop software that is used to provide services to customers. Capitalization of internal-use software, primarily associated with operating platforms, occurs when we have completed the preliminary project stage, management authorizes the project, management commits to funding the project, it is probable the project will be completed and the project will be used to perform the function intended. The preliminary project stage consists of the conceptual formulation of alternatives, the evaluation of alternatives, the determination of existence of needed technology and the final selection of alternatives. Costs incurred during the preliminary project stage are expensed as incurred. Capitalized internal-use software is amortized over its estimated useful life, which is typically two to ten years, in a manner that best reflects the pattern of economic use of the assets.
Goodwill— We perform our annual goodwill impairment test as of October 1 each year. We test goodwill for impairment at the reporting unit level annually and more often if an event occurs or circumstances change that indicate the fair value of a reporting unit is below its carrying amount. We have the option of performing a qualitative assessment of impairment to determine whether any further quantitative assessment for impairment is necessary. The option of whether or not to perform a qualitative assessment is made annually and may vary by reporting unit.
Factors we consider in the qualitative assessment include general macroeconomic conditions, industry and market conditions, cost factors, overall financial performance of our reporting units, events or changes affecting the composition or carrying amount of the net assets of our reporting units, sustained decrease in our share price, and other relevant entity-specific events. If we elect to bypass the qualitative assessment or if we determine, on the basis of qualitative factors, that the fair value of the reporting unit is more likely than not less than the carrying amount, a quantitative test would be required.
Prior to the Merger, our reporting units consisted of: North America Payments, Integrated Solutions and Vertical Markets, United Kingdom, Asia-Pacific, Central and Eastern Europe, Russia and Spain. As of October 1, 2019, we elected to perform a quantitative assessment of impairment for each of these reporting units, and determined on the basis of those assessments that the fair value of each reporting unit is greater than its respective carrying amount. As of October 1, 2019, we had not allocated goodwill associated with the Merger to any of our reporting units; however, no indicators of impairment existed that warranted further evaluation of the provisional goodwill.
After October 1, 2019, as a result of the Merger, we realigned our reporting units based on new executive management and organizational structures consisting of: North America Payment Solutions, Integrated Solutions, Vertical Market Software Solutions, Europe Merchant Solutions, Spain Merchant Solutions, Asia-Pacific Merchant Solutions, Issuer Solutions and Business and Consumer Solutions. After the reorganization of our reporting units, we performed a quantitative assessment of impairment for each of our new reporting units, and determined on the basis of those assessments that the fair value of each reporting unit is equal to or greater than its respective carrying amount. We believe that the fair value of each of our reporting units is substantially in excess of its carrying amount, except for Issuer Solutions and Business and Consumer Solutions for which the respective carrying amounts approximate fair value since they were acquired in the Merger.
61
Other intangible assets— Other intangible assets include customer-related intangible assets (such as customer lists, merchant contracts and distributor agreements), contract-based intangible assets (such as noncompete agreements, referral agreements and processing rights), acquired technologies, trademarks and trade names associated with business combinations. These assets are amortized over their estimated useful lives. The useful lives for customer-related intangible assets are determined based primarily on forecasted cash flows, which include estimates for the revenues, expenses, and customer attrition associated with the assets. The useful lives of contract-based intangible assets are equal to the terms of the agreements. The useful lives of amortizable trademarks and trade names are based on our plans to use the trademarks and trade names in the applicable markets. We use the straight-line method of amortization for our acquired technologies, trademarks and trade names and contract-based intangibles.
Amortization for most of our customer-related intangible assets is determined using an accelerated method. The first step in determining the amortization expense for any period is that we calculate the expected cash flows for that period that were used in determining the acquisition-date fair value of the asset divided by the expected total cash flows over the estimated life of the asset. We then multiply that percentage by the initial carrying amount of the asset to arrive at the amortization expense for that period. If the cash flow patterns that we experience differ significantly from our initial estimates, we adjust the amortization schedule prospectively. These cash flow patterns are derived using certain assumptions and cost allocations due to a significant number of asset interdependencies that exist in our business. We believe that our accelerated method reflects the expected pattern of the benefit to be derived from the acquired customer relationships.
Impairment of long-lived assets— We regularly evaluate whether events and circumstances have occurred that indicate the carrying amount of property and equipment and finite-life intangible assets may not be recoverable. When factors indicate that these long-lived assets should be evaluated for possible impairment, we assess the potential impairment by determining whether the carrying amount of such long-lived assets will be recovered through the future undiscounted cash flows expected from use of the asset and its eventual disposition. The evaluation is performed at the asset group level, which is the lowest level of identifiable cash flows. If the carrying amount of the asset group is determined not to be recoverable, a write-down to fair value is recorded. Fair values are determined based on quoted market prices or discounted cash flow analysis as applicable. We regularly evaluate whether events and circumstances have occurred that indicate the useful lives of property and equipment and finite-life intangible assets may warrant revision.
Leases— We evaluate each of our lease and service arrangements at inception to determine if the arrangement is, or contains, a lease and the appropriate classification of each identified lease. A lease exists if we obtain substantially all of the economic benefits of, and have the right to control the use of, an asset for a period of time. Right-of-use assets represent our right to use an underlying asset for the lease term, and lease liabilities represent our obligation to make lease payments arising from the lease agreement. We recognize right-of-use assets and lease liabilities at the lease commencement date based on the present values of fixed lease payments over the term of the lease. Right-of-use assets may also be adjusted to reflect any prepayments made or any incentive payments received. Operating lease costs and depreciation expense for finance leases are recognized as expense on a straight-line basis over the lease term. We consider a termination or renewal option in the determination of the lease term when it is reasonably certain that we will exercise that option. Because our leases generally do not provide a readily determinable implicit interest rate, we use an incremental borrowing rate to measure the lease liability and associated right-of-use asset at the lease commencement date. The incremental borrowing rate used is a fully collateralized rate that considers our credit rating, market conditions and the term of the lease at the lease commencement date.
Accrued buyout liability— Certain of our Merchant Solutions salespersons in the United States are paid residual commissions based on the profitability generated by certain merchants. We have the right, but not the obligation, to buy out some or all of these commissions and intend to do so periodically. Such purchases of the commissions are at a fixed multiple of the last 12 months of commissions. Because of our intent and ability to execute purchases of the residual commissions, and the mutual understanding between us and our salespersons, we have accounted for this deferred compensation arrangement pursuant to the substantive nature of the plan. Therefore, we recognize a liability for the amount that we would have to pay (the "settlement cost") to buy out related commissions in their entirety from vested salespersons, and an estimated amount for unvested salespersons based on their progress towards vesting and the expected percentage that will become vested. As noted above, as the liability increases over the first year of the related merchant contract, we record a related asset. Subsequent changes in the estimated accrued buyout liability due to merchant attrition, same-store sales growth or contraction and changes in profitability are included in the selling, general and administrative expense in the consolidated statements of income. The classification of the accrued buyout liability between current and noncurrent on the consolidated balance sheet is based upon our estimate of the amount of the accrued buyout liability that we reasonably expect to pay over the next 12 months.
62
Income taxes— Deferred income taxes are determined based on the difference between the financial statement and tax bases of assets and liabilities using enacted tax laws and rates. A valuation allowance is provided when it is more likely than not that some portion or all of the deferred tax assets will not be realized.
We periodically assess our tax exposures related to periods that are open to examination. Based on the latest available information, we evaluate our tax positions to determine whether the position will more likely than not be sustained upon examination by the U.S. Internal Revenue Service or other taxing authorities. If we cannot reach a more-likely-than-not determination, no benefit is recorded. If we determine that the tax position is more likely than not to be sustained, we record the largest amount of benefit that is more likely than not to be realized when the tax position is settled. We record interest and penalties related to unrecognized income tax benefits in interest and selling, general and administrative expenses, respectively, in our consolidated statements of income.
Derivative instruments— We may use interest rate swaps or other derivative instruments to manage a portion of our exposure to the variability in interest rates. Our objective in managing our exposure to fluctuation in interest rates is to better control this element of cost and to mitigate the earnings and cash flow volatility associated with changes in applicable rates. We have established policies and procedures that encompass risk-management philosophy and objectives, guidelines for derivative instrument usage, counterparty credit approval, and the monitoring and reporting of derivative activity. We do not use derivative instruments for speculation.
At inception we formally designate and document instruments that qualify for hedge accounting of underlying exposures. When qualified for hedge accounting, these financial instruments are recognized at fair value in our consolidated balance sheets, and changes in fair value are recognized as a component of other comprehensive income (loss) and included in accumulated other comprehensive loss within equity in our consolidated balance sheets. Cash flows resulting from settlements are presented as a component of cash flows from operating activities within our consolidated statements of cash flows.
We formally assess, both at inception and at least quarterly, whether the financial instruments used in hedging transactions are effective at offsetting changes in cash flows of the related underlying exposure. Fluctuations in the value of these instruments generally are offset by changes in the forecasted cash flows of the underlying exposures being hedged. This offset is driven by the high degree of effectiveness between the exposure being hedged and the hedging instrument. We designated each of our interest rate swap agreements as a cash flow hedge of interest payments on variable rate borrowings. See "Note 7—Long-Term Debt and Lines of Credit" for more information about our interest rate swaps.
Fair value measurements— Fair value is defined as the price that would be received to sell an asset or paid to transfer a liability in an orderly transaction between market participants at the reporting date. GAAP establishes a fair value hierarchy that categorizes the inputs to valuation techniques into three broad levels. Level 1 inputs utilize quoted prices in active markets for identical assets or liabilities. Level 2 inputs are based on other observable market data, such as quoted prices for similar assets and liabilities, and inputs other than quoted prices that are observable such as interest rates and yield curves. Level 3 inputs are developed from unobservable data reflecting our assumptions and include situations where there is little or no market activity for the asset or liability.
We also have investments in equity instruments without readily determinable fair value. As permitted, we have elected a measurement alternative for equity instruments that do not have readily determinable fair values. Under such alternative, these instruments are measured at cost plus or minus any changes resulting from observable price changes in orderly transactions for an identical or similar investment of the same issuer. Any resulting change in carrying amount would be reflected in net income.
63
Foreign currencies— We have significant operations in a number of foreign subsidiaries whose functional currency is the local currency. The assets and liabilities of subsidiaries whose functional currency is a foreign currency are translated into the reporting currency at the period-end rate of exchange. Income statement items are translated at the weighted-average rates prevailing during the period. The resulting translation adjustment is recorded as a component of other comprehensive income and is included in accumulated comprehensive income within equity in our consolidated balance sheets.
Gains and losses on transactions denominated in currencies other than the functional currency are generally included in determining net income for the period. For the years ended December 31, 2019, 2018 and 2017, our transaction gains and losses were insignificant. Transaction gains and losses on intercompany balances of a long-term investment nature are recorded as a component of other comprehensive income and included in accumulated comprehensive income within equity in our consolidated balance sheets.
Earnings per share— Basic earnings per share ("EPS") is computed by dividing reported net income attributable to Global Payments by the weighted-average number of shares outstanding during the period. Earnings available to common shareholders is the same as reported net income attributable to Global Payments for all periods presented.
Diluted EPS is computed by dividing net income attributable to Global Payments by the weighted-average number of shares outstanding during the period, including the effect of share-based awards that would have a dilutive effect on earnings per share. All stock options with an exercise price lower than the average market share price of our common stock for the period are assumed to have a dilutive effect on EPS. During the years ended December 31, 2019, 2018 and 2017, there were no stock options that would have an antidilutive effect on the computation of diluted EPS.
The following table sets forth the computation of the diluted weighted-average number of shares outstanding for all periods presented:
Years Ended December 31, | ||||||||
2019 | 2018 | 2017 | ||||||
(in thousands) | ||||||||
Basic weighted-average number of shares outstanding | ||||||||
Plus: Dilutive effect of stock options and other share-based awards | ||||||||
Diluted weighted-average number of shares outstanding | ||||||||
Repurchased shares— We account for the retirement of repurchased shares using the par value method under which the repurchase price is charged to paid-in capital up to the amount of the original issue proceeds of those shares. When the repurchase price is greater than the original issue proceeds, the excess is charged to retained earnings. We use a last-in, first-out cost flow assumption to identify the original issue proceeds of the shares repurchased.
64
Recently issued pronouncements not yet adopted— In August 2018, the FASB issued ASU 2018-15, "Intangibles - Goodwill and Other - Internal-Use Software (Subtopic 350-40): Customer's Accounting for Implementation Costs Incurred in a Cloud Computing Arrangement that is a Service Contract (A Consensus of the FASB Emerging Issues Task Force)." ASU 2018-15 provides additional guidance on the accounting for costs of implementation activities performed in a cloud computing arrangement (i.e., hosting arrangement) that is a service contract. The new guidance amends the definition of a hosting arrangement and requires a customer in a hosting arrangement that is a service contract to capitalize certain implementation costs as if the arrangement was an internal-use software project. The amendments in this update also provide additional presentation and disclosure requirements, including requirements to disclose the nature of an entity’s hosting arrangements that are service contracts, as well as quantitative information about capitalized implementation costs and related amortization expense. The guidance will become effective for us on January 1, 2020. We expect to apply the guidance prospectively to all implementation costs incurred after the date of adoption. We have completed our evaluation of the effect of ASU 2018-15 on our consolidated financial statements and internal controls. We do not expect the adoption of this standard to have a material effect on our consolidated financial statements. We have historically capitalized implementation costs associated with cloud computing arrangements that are service contracts following the guidance in Subtopic 350-40 and expect to continue to do so pursuant to the clarifications provided in the new guidance. We expect to amortize deferred implementation costs to expense on a straight-line basis over the term of the applicable hosting arrangement, and we will enhance our accounting processes and internal controls to meet the new disclosure requirements.
In June 2016, the FASB issued ASU 2016-13, "Financial Instruments - Credit Losses (Topic 326): Measurement of Credit Losses on Financial Instruments." The amendments in this update change how companies measure and recognize credit impairment for many financial instruments measured at amortized cost. The new model for current expected credit losses ("CECL") will require us to recognize an estimate of credit losses expected to occur over the remaining life of the financial instruments that are within the scope of the update, including accounts receivable and certain settlement processing assets, each of which are short-term in nature. Under current GAAP, credit losses on these financial instruments are not recognized until their occurrence is deemed to be probable. The guidance will become effective for us on January 1, 2020. In general, the new guidance will require modified retrospective application to all outstanding financial assets that are within the scope of the update, with a cumulative-effect adjustment, if any, recorded to retained earnings as of the date of adoption. We are substantially complete with our evaluation of the effect of ASU 2016-13 on our consolidated financial statements. We do not expect adoption of this standard will have a material effect on our consolidated financial statements; however, it may require expanded qualitative disclosures about our financial assets and related allowance for credit losses, as well as new or modified internal controls.
In December 2019, the FASB issued ASU 2019-12, "Income Taxes (Topic 740): Simplifying the Accounting for Income Taxes," which is intended to enhance and simplify various aspects of the accounting for income taxes. The amendments in this update remove certain exceptions to the general principles in Topic 740 related to the approach for intraperiod tax allocation, the methodology for calculating income taxes in an interim period and the recognition of deferred tax liabilities for outside basis differences. ASU 2019-12 also clarifies and amends existing guidance to improve consistent application of the accounting for franchise taxes, enacted changes in tax laws or rates and transactions that result in a step-up in the tax basis of goodwill. ASU 2019-12 is effective for annual and interim periods beginning after December 15, 2020, with early adoption permitted. We are evaluating the effect of ASU 2019-12 on our consolidated financial statements.
NOTE 2— ACQUISITIONS
The transactions described below were accounted for as business combinations, which generally requires that we record the assets acquired and liabilities assumed at fair value as of the acquisition date.
Total System Services, Inc.
On September 18, 2019, we acquired all of the outstanding common stock of TSYS. Prior to the Merger, TSYS was a leading global payments provider, offering seamless, secure and innovative solutions to issuers, merchants and consumers.
65
Holders of TSYS common stock received 0.8101 shares of Global Payments common stock for each share of TSYS common stock they owned at the effective time of the Merger (the "Exchange Ratio"). In addition, certain TSYS equity awards held by employees who were not executive officers, pursuant to their terms, vested automatically at closing ("Single-Trigger Awards") and were converted into the right to receive a number of shares of Global Payments common stock determined based on the Exchange Ratio. Also, pursuant to the Merger Agreement, we granted equity awards for approximately 2.2 million shares of Global Payments common stock to certain TSYS equity awards holders ("Replacement Awards"). Each such Replacement Award is subject to the same terms and conditions (including vesting and exercisability or payment terms) as applied to the corresponding TSYS equity award. We apportioned the fair value of the Replacement Awards between purchase consideration and amounts to be recognized in periods following the Merger as share-based compensation expense over the requisite service period of the Replacement Awards.
The purchase consideration transferred to TSYS shareholders was valued at $23.8 billion. Total purchase consideration also included the amount of borrowings outstanding under TSYS' unsecured revolving credit facility together with accrued interest and fees that we were required to repay upon consummation of the Merger.
The fair value of total purchase consideration was determined as follows (in thousands, except per share data):
Shares of TSYS common stock issued and outstanding (including Single-Trigger Awards) | ||||
Exchange Ratio | ||||
Shares of Global Payments common stock issued to TSYS shareholders | ||||
Price per share of Global Payments common stock | $ | |||
Fair value of common stock issued to TSYS shareholders(1) | ||||
Value of Replacement Awards attributable to purchase consideration | ||||
Cash paid to TSYS shareholders in lieu of fractional shares | ||||
Total purchase consideration transferred to TSYS shareholders | ||||
Repayment of TSYS' unsecured revolving credit facility (including accrued interest and fees) | ||||
Total purchase consideration | $ | |||
(1) Fair value of common stock issued to TSYS shareholders does not equal the product of shares of Global Payments common stock issued to TSYS shareholders and price per share of Global Payments common stock as presented in the table above due to the rounding of the number of shares in thousands.
66
The provisional estimated acquisition-date fair values of major classes of assets acquired and liabilities assumed as of December 31, 2019, including a reconciliation to the total purchase consideration, were as follows (in thousands):
Provisional Amounts at Acquisition Date | Measurement- Period Adjustments | Provisional Amounts at December 31, 2019 | ||||||||||
(in thousands) | ||||||||||||
Cash and cash equivalents | $ | $ | ( | ) | $ | |||||||
Accounts receivable | ( | ) | ||||||||||
Identified intangible assets | ( | ) | ||||||||||
Property and equipment | ( | ) | ||||||||||
Other assets | ( | ) | ||||||||||
Accounts payable and accrued liabilities | ( | ) | ( | ) | ( | ) | ||||||
Debt | ( | ) | ( | ) | ( | ) | ||||||
Deferred income tax liabilities | ( | ) | ( | ) | ||||||||
Other liabilities | ( | ) | ( | ) | ( | ) | ||||||
Total identifiable net assets | ||||||||||||
Goodwill | ( | ) | ||||||||||
Total purchase consideration | $ | $ | $ | |||||||||
As of December 31, 2019, we considered these amounts to be provisional because we were still in the process of gathering and reviewing information to support the valuations of the assets acquired and liabilities assumed. We made measurement-period adjustments, as shown in the table above, that decreased the amount of provisional goodwill by $41.7 million. The effects of the measurement-period adjustments on our consolidated statement of income for the fourth quarter of 2019 were not material.
As of December 31, 2019, provisional goodwill arising from the acquisition of $17.4 billion was included in our reportable segments as follows: $7.1 billion in the Merchant Solutions segment, $7.9 billion in the Issuer Solutions segment and $2.4 billion in the Business and Consumer Solutions segment. Goodwill was attributable to expected growth opportunities, an assembled workforce and potential synergies from combining the acquired business into our existing business. We expect that substantially all of the goodwill from this acquisition will not be deductible for income tax purposes.
The following table reflects the provisional estimated fair values of the identified intangible assets of TSYS and the respective weighted-average estimated amortization periods:
Estimated Fair Values | Weighted-Average Estimated Amortization Periods | ||||
(in thousands) | (years) | ||||
Customer-related intangible assets | $ | ||||
Contract-based intangible assets | |||||
Acquired technologies | |||||
Trademarks and trade names | |||||
Total estimated identified intangible assets | $ | ||||
From the acquisition date through December 31, 2019, the acquired operations of TSYS contributed $1,215.0 million to our consolidated revenues and $78.7 million to operating income. Transaction costs directly related to the Merger were $68.9 million for the year ended December 31, 2019, respectively.
The following unaudited pro forma information shows the results of our operations for the years ended December 31, 2019 and 2018 as if the Merger had occurred on January 1, 2018. The unaudited pro forma information is presented for informational
67
purposes only and is not necessarily indicative of what would have occurred if the Merger had occurred as of that date. The unaudited pro forma information is also not intended to be a projection of future results due to the integration of the acquired operations of TSYS. The unaudited pro forma information reflects the effects of applying our accounting policies and certain pro forma adjustments to the combined historical financial information of Global Payments and TSYS. The pro forma adjustments include:
• | incremental amortization expense associated with identified intangible assets; |
• | a reduction of revenues and operating expenses associated with fair value adjustments made to acquired assets and assumed liabilities, such as contract cost assets and contract liabilities; |
• | a reduction of interest expense resulting from financing of the Merger, the repayment of TSYS' secured revolving credit facility and fair value adjustments applied to TSYS debt that we assumed; and |
• | the income tax effects of the pro forma adjustments. |
In addition, the pro forma net income attributable to Global Payments includes recognition of transaction costs related to the Merger in earnings as of the beginning of the earliest period presented. Accordingly, pro forma net income attributable to Global Payments for the year ended December 31, 2018 includes approximately $150 million of transaction costs.
Year Ended December 31, 2019 | Year Ended December 31, 2018 | ||||||||||||||
Actual | Pro Forma | Actual | Pro Forma | ||||||||||||
(in thousands) | |||||||||||||||
Total revenues | $ | $ | $ | $ | |||||||||||
Net income attributable to Global Payments | $ | $ | $ | $ | |||||||||||
SICOM Systems, Inc.
On October 17, 2018, we acquired SICOM Systems, Inc. ("SICOM") for total purchase consideration of $410.2 million, which we funded with cash on hand and incremental debt. SICOM is a provider of end-to-end enterprise, cloud-based software solutions and other technologies to quick service restaurants and food service management companies. Prior to the acquisition, SICOM was indirectly owned by a private equity investment firm where one of our board members was a partner and investor. His direct interest in the transaction was approximately $1.1 million, the amount distributed to him based on his investment interest in the fund of the private equity firm that sold SICOM to us. Based on consideration of all relevant information, the audit committee of our board of directors recommended that the board approve the acquisition of SICOM, which it did.
The estimated acquisition-date fair values of major classes of assets acquired and liabilities assumed, including a reconciliation to the total purchase consideration, were as follows:
Provisional Amounts at December 31, 2018 | Measurement- Period Adjustments | Final | ||||||||||
(in thousands) | ||||||||||||
Cash and cash equivalents | $ | $ | $ | |||||||||
Property and equipment | ( | ) | ||||||||||
Identified intangible assets | ||||||||||||
Other assets | ( | ) | ||||||||||
Deferred income tax liabilities | ( | ) | ( | ) | ||||||||
Other liabilities | ( | ) | ( | ) | ( | ) | ||||||
Total identifiable net assets | ||||||||||||
Goodwill | ||||||||||||
Total purchase consideration | $ | $ | $ | |||||||||
68
Goodwill arising from the acquisition of $265.2 million, included in the Merchant Solutions segment, was attributable to expected growth opportunities, an assembled workforce and potential synergies from combining the acquired business into our existing business. We expect that approximately $40.0 million of the goodwill from this acquisition will be deductible for income tax purposes.
The following table reflects the estimated fair values of the identified intangible assets of SICOM and the respective weighted-average estimated amortization periods:
Estimated Fair Values | Weighted-Average Estimated Amortization Periods | ||||
(in thousands) | (years) | ||||
Customer-related intangible assets | $ | ||||
Acquired technologies | |||||
Trademarks and trade names | |||||
Contract-based intangible assets | |||||
Total estimated acquired intangible assets | $ | ||||
AdvancedMD
On September 4, 2018, we acquired AdvancedMD, Inc. ("AdvancedMD") for total purchase consideration of $706.9 million, which we funded with cash on hand and incremental debt. AdvancedMD is a provider of cloud-based enterprise software solutions to small-to-medium sized ambulatory-care physician practices.
The estimated acquisition-date fair values of major classes of assets acquired and liabilities assumed, including a reconciliation to the total purchase consideration, were as follows:
Provisional Amounts at December 31, 2018 | Measurement- Period Adjustments | Final | ||||||||||
(in thousands) | ||||||||||||
Cash and cash equivalents | $ | $ | $ | |||||||||
Property and equipment | ||||||||||||
Identified intangible assets | ||||||||||||
Other assets | ( | ) | ||||||||||
Deferred income tax liabilities | ( | ) | ( | ) | ||||||||
Other liabilities | ( | ) | ( | ) | ( | ) | ||||||
Total identifiable net assets | ||||||||||||
Goodwill | ( | ) | ||||||||||
Total purchase consideration | $ | $ | $ | |||||||||
Goodwill arising from the acquisition of $372.0 million, included in the Merchant Solutions segment, was attributable to expected growth opportunities, an assembled workforce and potential synergies from combining the acquired business into our existing business. We expect that substantially all of the goodwill from this acquisition will not be deductible for income tax purposes.
69
The following table reflects the estimated fair values of the identified intangible assets of AdvancedMD and the respective weighted-average estimated amortization periods:
Estimated Fair Values | Weighted-Average Estimated Amortization Periods | ||||
(in thousands) | (years) | ||||
Customer-related intangible assets | $ | ||||
Acquired technologies | |||||
Trademarks and trade names | |||||
Total estimated identified intangible assets | $ | ||||
ACTIVE Network
We acquired the communities and sports divisions of Athlaction Topco, LLC ("ACTIVE Network") on September 1, 2017, for total purchase consideration of $1.2 billion. ACTIVE Network delivers cloud-based enterprise software, including payment technology solutions, to event organizers in the communities and health and fitness markets.
The following table summarizes the cash and noncash components of the consideration transferred on September 1, 2017 (in thousands):
Cash consideration paid to ACTIVE Network stockholders | $ | |||
Fair value of Global Payments common stock issued to ACTIVE Network stockholders | ||||
Total purchase consideration | $ | |||
We funded the cash consideration with cash on hand and incremental debt. The acquisition-date fair value of 6,357,509 shares of our common stock issued to the sellers was determined based on the share price of our common stock as of the acquisition date and the effect of certain transfer restrictions.
The estimated acquisition-date fair values of major classes of assets acquired and liabilities assumed, including a reconciliation to the total purchase consideration, were as follows (in thousands):
Cash and cash equivalents | $ | |||
Property and equipment | ||||
Identified intangible assets | ||||
Other assets | ||||
Deferred income taxes | ( | ) | ||
Other liabilities | ( | ) | ||
Total identifiable net assets | ||||
Goodwill | ||||
Total purchase consideration | $ | |||
Goodwill of $784.2 million arising from the acquisition, included in the Merchant Solutions segment, was attributable to expected growth opportunities, an assembled workforce and potential synergies from combining our existing businesses. We expect that approximately 80 % of the goodwill will be deductible for income tax purposes.
70
The following table reflects the estimated fair values of the identified intangible assets and the respective weighted-average estimated amortization periods:
Estimated Fair Values | Weighted-Average Estimated Amortization Periods | ||||
(in thousands) | (years) | ||||
Customer-related intangible assets | $ | ||||
Acquired technologies | |||||
Trademarks and trade names | |||||
Contract-based intangible assets | |||||
Total estimated acquired intangible assets | $ | ||||
Valuation of Identified Intangible Assets
NOTE 3—REVENUES
The disclosures in this note arose from our adoption of ASC 606 on January 1, 2018 and are applicable for the years ended December 31, 2019 and 2018.
The following tables present a disaggregation of our revenues from contracts with customers by geography for each of our reportable segments:
Year Ended December 31, 2019 | |||||||||||||||||||
Merchant Solutions | Issuer Solutions | Business and Consumer Solutions | Intersegment Revenues | Total | |||||||||||||||
(in thousands) | |||||||||||||||||||
Americas | $ | $ | $ | $ | ( | ) | $ | ||||||||||||
Europe | |||||||||||||||||||
Asia Pacific | |||||||||||||||||||
$ | $ | $ | $ | ( | ) | $ | |||||||||||||
71
Year Ended December 31, 2018 | |||||||||||||||||||
Merchant Solutions | Issuer Solutions | Business and Consumer Solutions | Intersegment Revenues | Total | |||||||||||||||
(in thousands) | |||||||||||||||||||
Americas | $ | $ | $ | $ | $ | ||||||||||||||
Europe | |||||||||||||||||||
Asia Pacific | |||||||||||||||||||
$ | $ | $ | $ | $ | |||||||||||||||
The following table presents a disaggregation of our Merchant Solutions segment revenues by distribution channel for the years ended December 31, 2019 and 2018:
2019 | 2018 | ||||||
(in thousands) | |||||||
Direct: | |||||||
Relationship-led | $ | $ | |||||
Technology-enabled | |||||||
$ | $ | ||||||
ASC 606 requires that we determine for each customer arrangement whether revenues should be recognized at a point in time or over time. For the years ended December 31, 2019 and 2018 substantially all of our revenues were recognized over time.
Supplemental balance sheet information related to contracts from customers as of December 31, 2019 and 2018 was as follows:
Balance Sheet Location | December 31, 2019 | December 31, 2018 | |||||||
(in thousands) | |||||||||
Assets: | |||||||||
Capitalized costs to obtain customer contracts, net | Other noncurrent assets | $ | $ | ||||||
Capitalized costs to fulfill customer contracts, net | Other noncurrent assets | ||||||||
Liabilities: | |||||||||
Contract liabilities, net (current) | Accounts payable and accrued liabilities | ||||||||
Contract liabilities, net (noncurrent) | Other noncurrent liabilities | ||||||||
The increase in contract liabilities during the year ended December 31, 2019 was primarily attributable to contract liabilities assumed in the Merger. Net contract assets were not material at December 31, 2019 or December 31, 2018. Revenue recognized for the year ended December 31, 2019 and 2018 from contract liability balances at the beginning of each period was $137.2 million and $97.3 million, respectively.
72
ASC 606 requires disclosure of the aggregate amount of the transaction price allocated to unsatisfied performance obligations. The purpose of this disclosure is to provide additional information about the amounts and expected timing of revenue to be recognized from the remaining performance obligations in our existing contracts. The following table includes estimated revenues expected to be recognized in the future related to performance obligations that are unsatisfied or partially unsatisfied at the end of the reporting period. However, as permitted by ASC 606, we have elected to exclude from this disclosure any contracts with an original duration of one year or less and any variable consideration that meets specified criteria. Accordingly, the total unsatisfied or partially unsatisfied performance obligations related to processing services is significantly higher than the amounts disclosed in table below. Estimated revenues expected to be recognized in the future related to performance obligations that are unsatisfied or partially unsatisfied at December 31, 2019 were as follows (in thousands):
Years ending December 31, | |||
2020 | $ | ||
2021 | |||
2022 | |||
2023 | |||
2024 | |||
2025-2029 | |||
Total | $ | ||
NOTE 4—PROPERTY AND EQUIPMENT
As of December 31, 2019 and 2018, property and equipment consisted of the following:
Range of Depreciable Lives | 2019 | 2018 | |||||||
(Years) | (in thousands) | ||||||||
Software | 1-10 | $ | $ | ||||||
Equipment | 1-20 | ||||||||
Buildings | 2-43 | ||||||||
Leasehold improvements | 2-40 | ||||||||
Furniture and fixtures | 1-10 | ||||||||
Land | |||||||||
Less accumulated depreciation and amortization | ( | ) | ( | ) | |||||
Work-in-progress | |||||||||
$ | $ | ||||||||
73
NOTE 5—GOODWILL AND OTHER INTANGIBLE ASSETS
As of December 31, 2019 and 2018, goodwill and other intangible assets consisted of the following:
2019 | 2018 | ||||||
(in thousands) | |||||||
Goodwill | $ | $ | |||||
Other intangible assets: | |||||||
Customer-related intangible assets | $ | $ | |||||
Acquired technologies | |||||||
Contract-based intangible assets | |||||||
Trademarks and trade names | |||||||
Less accumulated amortization: | |||||||
Customer-related intangible assets | |||||||
Acquired technologies | |||||||
Contract-based intangible assets | |||||||
Trademarks and trade names | |||||||
$ | $ | ||||||
On December 31, 2019, we acquired a merchant portfolio from Desjardins Group, the leading cooperative financial group in Canada. We accounted for the acquisition as an asset purchase and recorded customer-related intangible assets of $307.9 million.
The following table sets forth the changes by reportable segment in the carrying amount of goodwill for the years ended December 31, 2019, 2018 and 2017:
Merchant Solutions | Issuer Solutions | Business and Consumer Solutions | Total | ||||||||||||
(in thousands) | |||||||||||||||
Balance at December 31, 2016 | $ | $ | $ | $ | |||||||||||
Goodwill acquired | |||||||||||||||
Effect of foreign currency translation | |||||||||||||||
Measurement-period adjustments | |||||||||||||||
Balance at December 31, 2017 | |||||||||||||||
Goodwill acquired | |||||||||||||||
Effect of foreign currency translation | ( | ) | ( | ) | ( | ) | |||||||||
Measurement-period adjustments | ( | ) | ( | ) | |||||||||||
Balance at December 31, 2018 | |||||||||||||||
Goodwill acquired | |||||||||||||||
Effect of foreign currency translation | |||||||||||||||
Measurement-period adjustments | |||||||||||||||
Balance at December 31, 2019 | $ | $ | $ | $ | |||||||||||
There were no accumulated impairment losses for goodwill at any balance sheet date reflected in the table above.
74
Customer-related intangible assets, acquired technologies, contract-based intangible assets and trademarks and trade names acquired during the year ended December 31, 2019 had weighted-average amortization periods of 15.1 years, 6.9 years, 17.7 years and 10.7 years, respectively. Customer-related intangible assets, acquired technologies, contract-based intangible assets and trademarks and trade names acquired during the year ended December 31, 2018 had weighted-average amortization periods of 11.5 years, 6.2 years, 19.3 years and 12.5 years, respectively. Customer-related intangible assets, acquired technologies, contract-based intangible assets and trademarks and trade names acquired during the year ended December 31, 2017 had weighted-average amortization periods of 16.8 years, 8.8 years, 3.0 years and 15.0 years, respectively. Amortization expense of acquired intangibles was $667.1 million for the year ended December 31, 2019, $377.7 million for the year ended December 31, 2018 and $337.9 million for the year ended December 31, 2017.
The estimated amortization expense of acquired intangibles as of December 31, 2019 for the next five years, calculated using the currency exchange rate at the date of acquisition, if applicable, is as follows (in thousands):
2020 | $ | ||
2021 | |||
2022 | |||
2023 | |||
2024 | |||
NOTE 6—LEASES
Our leases consist primarily of operating real estate leases for office space and data centers in the markets in which we conduct business. We also have operating and finance leases for computer and other equipment. Many of our leases include escalating rental payments and incentives, as well as termination and renewal options. Certain of our lease agreements provide that we pay the cost of property taxes, insurance and maintenance. As described in "Note 1—Basis of Presentation and Summary of Significant Accounting Policies," we adopted ASU 2016-02 on January 1, 2019. Unless otherwise indicated, the following information in this footnote applies only to periods after December 31, 2018.
The effects of adopting ASU 2016-02 on our balance sheet as of January 1, 2019 are set forth in the table below. Adoption did not have a material effect on any line items in our consolidated statement of income or on our cash flows from operating activities, investing activities or financing activities included in our consolidated statement of cash flows.
75
As of December 31, 2019 and January 1, 2019, right-of-use assets and lease liabilities consisted of the following:
Balance Sheet Location | December 31, 2019 | January 1, 2019 | ||||||||
(in thousands) | ||||||||||
Assets: | ||||||||||
Operating lease right-of-use assets: | ||||||||||
Real estate | Other noncurrent assets | $ | $ | |||||||
Computer equipment | Other noncurrent assets | |||||||||
Other | Other noncurrent assets | |||||||||
Total operating lease right-of-use-assets | $ | $ | ||||||||
Finance lease right-of-use assets: | ||||||||||
Computer equipment | Property and equipment, net | $ | $ | |||||||
Other | Property and equipment, net | |||||||||
Less accumulated depreciation: | ||||||||||
Computer equipment | Property and equipment, net | ( | ) | |||||||
Other | Property and equipment, net | ( | ) | |||||||
Total accumulated depreciation | ( | ) | ||||||||
Total finance lease right-of-use assets | ||||||||||
Total right-of-use assets(1) | $ | $ | ||||||||
Liabilities: | ||||||||||
Operating lease liabilities (current) | Accounts payable and accrued liabilities | $ | $ | |||||||
Operating lease liabilities (noncurrent) | Other noncurrent liabilities | |||||||||
Finance lease liabilities (current) | Current portion of long-term debt | |||||||||
Finance lease liabilities (noncurrent) | Long-term debt | |||||||||
Total lease liabilities | $ | $ | ||||||||
(1) Approximately 82 % of our right-of-use assets are located in the United States.
The weighted-average remaining lease term for operating and finance leases at December 31, 2019 was 7.4 years and 5.1 years, respectively. As of December 31, 2019, the weighted-average discount rate used in the measurement of operating and finance lease liabilities was 4.1 % and 2.8 %, respectively.
As of December 31, 2019, maturities of lease liabilities were as follows:
Operating Leases | Finance Leases | |||||||
(in thousands) | ||||||||
Years ending December 31, | ||||||||
2020 | $ | $ | ||||||
2021 | ||||||||
2022 | ||||||||
2023 | ||||||||
2024 | ||||||||
2025 and thereafter | ||||||||
Total lease payments(1) | ||||||||
Imputed interest | ( | ) | ( | ) | ||||
Total lease liabilities | $ | $ | ||||||
76
(1) Total operating lease payments did not include approximately $64 million for operating leases that had not yet commenced at December 31, 2019. We expect the lease commencement dates for these leases to occur in 2020.
Operating lease costs in our consolidated statement of income for the year ended December 31, 2019 were $85.9 million, including $71.0 million in selling, general and administrative expenses and $14.9 million in cost of services. Total lease costs for the year ended December 31, 2019 include variable lease costs of approximately $19.1 million, which are primarily comprised of the cost of property taxes, insurance and maintenance. Finance lease costs and lease costs for leases with a term of less than 12 months were not material for the year ended December 31, 2019.
Cash paid for amounts included in the measurement of operating lease liabilities for the year ended December 31, 2019 was $70.4 million, which is included as a component of cash provided by operating activities in the consolidated statement of cash flows. Operating lease liabilities arising from obtaining new or modified right-of-use assets, net of reductions resulting from certain lease modifications, were approximately $28.4 million for the year ended December 31, 2019. In connection with the Merger, we acquired right-of-use assets and assumed lease liabilities of $256.2 million and $272.0 million, respectively.
Future minimum payments at December 31, 2018 for noncancelable operating leases were as follows (in thousands):
Years ending December 31: | ||||
2019 | $ | |||
2020 | ||||
2021 | ||||
2022 | ||||
2023 | ||||
2024 and thereafter | ||||
Total future minimum payments(1) | $ | |||
(1) Future minimum lease payments included approximately $70 million for operating leases that had not commenced at December 31, 2018.
Rent expense on all operating leases for the years ended December 31, 2018 and 2017 was $47.1 million and $44.7 million, respectively. During the year ended December 31, 2017, we sold our operating facility in Jeffersonville, Indiana for $37.5 million and simultaneously leased the property back for an initial term of 20 years, followed by four optional renewal terms of five years . The arrangement met the criteria to be treated as a sale for accounting purposes, and as a result, we derecognized the associated property. There was no resulting gain or loss on the sale because the proceeds received were equal to the carrying amount of the property.
77
NOTE 7—LONG-TERM DEBT AND LINES OF CREDIT
As of December 31, 2019 and 2018, long-term debt consisted of the following:
December 31, 2019 | December 31, 2018 | ||||||
(in thousands) | |||||||
Long-term Debt | |||||||
3.800% senior notes due April 1, 2021 | $ | $ | |||||
3.750% senior notes due June 1, 2023 | |||||||
4.000% senior notes due June 1, 2023 | |||||||
2.650% senior notes due February 15, 2025 | |||||||
4.800% senior notes due April 1, 2026 | |||||||
4.450% senior notes due June 1, 2028 | |||||||
3.200% senior notes due August 15, 2029 | |||||||
4.150% senior notes due August 15, 2049 | |||||||
Unsecured term loan facility | |||||||
Unsecured revolving credit facility | |||||||
Secured term loans | |||||||
Secured revolving credit facility | |||||||
Finance lease liabilities | |||||||
Other borrowings | |||||||
Total long-term debt | |||||||
Less current portion | |||||||
Long-term debt, excluding current portion | $ | $ | |||||
The carrying amounts of our senior notes and term loans are presented net of unamortized discount and unamortized debt issuance costs, as applicable. At December 31, 2019, unamortized discount on senior notes was $5.9 million, and unamortized debt issuance costs on senior notes and the unsecured term loan facility were $46.6 million. Unamortized debt issuance costs on our secured term loans at December 31, 2018 were $37.4 million. The portion of unamortized debt issuance costs related to revolving credit facilities is included in other noncurrent assets. At December 31, 2019, unamortized debt issuance costs on the unsecured revolving credit facility were $17.6 million, and, at December 31, 2018, unamortized debt issuance costs on the secured revolving credit facility were $12.9 million. The debt discounts and debt issuance costs are recognized as an increase to interest expense over the terms of the respective debt instruments. Amortization of discounts and debt issuance costs was $11.9 million, $11.7 million and $11.8 million, respectively, for years ended December 31, 2019, 2018 and 2017.
At December 31, 2019, maturities of long-term debt (excluding finance lease liabilities) were as follows by year (in thousands):
Years ending December 31, | |||
2020 | $ | ||
2021 | |||
2022 | |||
2023 | |||
2024 | |||
2025 and thereafter | |||
Total | $ | ||
See "Note 6—Leases" for more information about our finance lease liabilities, including maturities.
78
Bridge Facility
On May 27, 2019, in connection with our entry into the Merger Agreement described in "Note 2—Acquisitions," we obtained commitments for a $2.75 billion, 364 -day senior unsecured bridge facility (the "Bridge Facility"). On July 9, 2019, upon our entry into the senior unsecured term loan and revolving credit facilities described below, the aggregate commitments under the Bridge Facility were reduced to approximately $2.1 billion. Concurrently with the issuance of our senior unsecured notes, the remaining aggregate commitments under the Bridge Facility were reduced to zero and terminated. During the year ended December 31, 2019, we recognized $11.7 million of fees associated with the Bridge Facility in interest expense.
Senior Unsecured Credit Facilities
On July 9, 2019, we entered into a term loan credit agreement ("Term Loan Credit Agreement") and a revolving credit agreement ("Unsecured Revolving Credit Agreement") in each case with Bank of America, N.A., as administrative agent, and a syndicate of financial institutions, as lenders and other agents. The Term Loan Credit Agreement provides for a senior unsecured $2.0 billion term loan facility, and the Unsecured Revolving Credit Agreement provides for a senior unsecured $3.0 billion revolving credit facility. We capitalized debt issuance costs of $12.8 million in connection with the issuances of these term loan and revolving credit facilities.
Borrowings under the term loan facility were made in U.S. dollars and borrowings under the revolving credit facility are available to be made in U.S. dollars, euros, sterling, Canadian dollars and, subject to certain conditions, certain other currencies at our option. Borrowings in U.S. dollars and certain other London Interbank Offered Rate ("LIBOR")-quoted currencies will bear interest, at our option, at a rate equal to either (1) the rate (adjusted for any statutory reserve requirements for eurocurrency liabilities) for eurodollar deposits in the London interbank market, (2) a floating rate of interest set forth on the applicable LIBOR screen page designated by Bank of America or (3) the highest of (a) the federal funds effective rate plus 0.5 %, (b) the rate of interest as publicly announced by Bank of America as its "prime rate" or (c) LIBOR plus 1.0 %, in each case, plus an applicable margin.
As of December 31, 2019, the interest rates on the term loan facility and the revolving credit facility were 3.2 % and 3.0 %, respectively. In addition, we are required to pay a quarterly commitment fee with respect to the unused portion of the revolving credit facility at an applicable rate per annum ranging from 0.125 % to 0.300 % depending on our credit rating. Beginning on December 31, 2022, and at the end of each quarter thereafter, the term loan facility must be repaid in quarterly installments in the amount of 2.50 % of original principal through the maturity date with the remaining principal balance due upon maturity in September 2024. The revolving credit facility also matures in September 2024.
We may issue standby letters of credit of up to $250 million in the aggregate under the revolving credit facility. Outstanding letters of credit under the revolving credit facility reduce the amount of borrowings available to us. The total available commitments under the revolving credit facility at December 31, 2019 were $2,077.5 million.
Senior Unsecured Notes
On August 14, 2019, we completed the public offering and issuance of $3.0 billion aggregate principal amount of senior unsecured notes, consisting of the following: (i) $1.0 billion aggregate principal amount of 2.650 % senior notes due 2025; (ii) $1.25 billion aggregate principal amount of 3.200 % senior notes due 2029; and (iii) $750.0 million aggregate principal amount of 4.150 % senior notes due 2049. Interest on the senior notes is payable semi-annually in arrears on each February 15 and August 15, beginning on February 15, 2020. Each series of the senior notes is redeemable, at our option, in whole or in part, at any time and from time-to-time at the redemption prices set forth in the related indenture. We issued the senior notes at a total discount of $6.1 million and capitalized related debt issuance costs of $29.6 million.
From August 14, 2019 until the closing of the Merger on September 18, 2019, the proceeds from the issuance of the senior notes were held in escrow. Upon closing, the funds were released and used together with borrowings under the term loan facility and the revolving credit facility, as well as cash on hand, to repay TSYS' unsecured revolving credit facility, refinance certain of our existing indebtedness, fund cash payments made in lieu of fractional shares and pay transaction fees and costs related to the Merger.
79
In addition, in connection with the Merger, we assumed $3.0 billion aggregate principal amount of senior unsecured notes of TSYS, consisting of the following: (i) $750 million aggregate principal amount of 3.800 % senior notes due 2021; (ii) $550 million aggregate principal amount of 3.750 % senior notes due 2023; (iii) $550 million aggregate principal amount of 4.000 % senior notes due 2023; (iv) $750 million aggregate principal amount of 4.800 % senior notes due 2026; and (v) $450 million aggregate principal amount of 4.450 % senior notes due 2028. For the 3.800 % senior notes due 2021 and the 4.800 % senior notes due 2026, interest is payable semi-annually each April 1 and October 1. For the 3.750 % senior notes due 2023, the 4.000 % senior notes due 2023 and the 4.450 % senior notes due 2028, interest is payable semi-annually each June 1 and December 1.
The senior notes assumed in the Merger were measured at fair value of $3.2 billion at the acquisition date, which exceeded their aggregate face value by $169.0 million. The difference between the fair value and face value of the assumed senior notes is recognized over the terms of the respective notes as a reduction of interest expense. The amortization of this fair value adjustment was $10.5 million for the year ended December 31, 2019.
As of December 31, 2019, our senior notes had an estimated fair value of $6.3 billion. The fair value of other long-term debt approximated its carrying amount at December 31, 2019.
Prior Credit Facility
Prior to completion of the Merger, we were party to a credit facility agreement with Bank of America, N.A., as administrative agent, and a syndicate of financial institutions, as lenders and other agents. The credit facility provided for secured financing comprised of (i) a $1.5 billion revolving credit facility; (ii) a $1.5 billion term loan; (iii) a $1.37 billion term loan; (iv) a $1.14 billion term loan; and (v) a $500.0 million term loan. Upon the consummation of the Merger, all borrowings outstanding and other amounts due under the credit facility were repaid and this credit facility was terminated. In connection with the extinguishment of this credit facility, we wrote off related unamortized debt issuance costs of $16.7 million to interest expense during the year ended December 31, 2019.
Compliance with Covenants
The senior unsecured term loan and revolving credit facilities contain customary conditions to funding, affirmative covenants, negative covenants, financial covenants and events of default. As of December 31, 2019, financial covenants under the term loan facility required a leverage ratio of 3.50 to 1.00 and an interest coverage ratio of 3.00 to 1.00. We were in compliance with all applicable covenants as of December 31, 2019.
Settlement Lines of Credit
In various markets where we do business, we have specialized lines of credit, which are restricted for use in funding settlement. The settlement lines of credit generally have variable interest rates, are subject to annual review and are denominated in local currency but may, in some cases, facilitate borrowings in multiple currencies. For certain of our lines of credit, the available credit is increased by the amount of cash we have on deposit in specific accounts with the lender. Accordingly, the amount of the outstanding line of credit may exceed the stated credit limit. As of December 31, 2019 and 2018, a total of $74.5 million and $70.6 million, respectively, of cash on deposit was used to determine the available credit.
As of December 31, 2019, we had $463.2 million outstanding under these lines of credit with additional capacity to fund settlement of $981.8 million. During the year ended December 31, 2019, the maximum and average outstanding balances under these lines of credit were $882.6 million and $423.2 million, respectively. The weighted-average interest rate on these borrowings was 3.16 % at December 31, 2019.
80
Derivative Agreements
We have interest rate swap agreements with financial institutions to hedge changes in cash flows attributable to interest rate risk on a portion of our variable-rate debt instruments. Net amounts to be received or paid under the swap agreements are reflected as adjustments to interest expense. Since we have designated the interest rate swap agreements as portfolio cash flow hedges, unrealized gains or losses resulting from adjusting the swaps to fair value are recorded as components of other comprehensive income (loss).
In addition, in June 2019, we entered into forward-starting interest rate swap agreements with an aggregate notional amount of $1.0 billion. The forward-starting interest rate swaps, designated as cash flow hedges, were designed to manage the exposure to interest rate volatility in anticipation of the issuance of our senior unsecured notes. During the period from the commencement of the swaps through the date upon which our senior unsecured notes were issued, the effective portion of the unrealized losses on the swaps was included in other comprehensive loss. Upon issuance of our senior unsecured notes, we terminated the forward-starting swap agreements and made settlement payments of $48.3 million, which are included in cash flows from operating activities in our consolidated statement of cash flows for the year ended December 31, 2019 within the caption labeled "Other, net." We have and will continue to reclassify the effective portion of the realized loss from accumulated other comprehensive loss into interest expense over the terms of the related senior notes. The fair values of our interest rate swaps were determined based on the present value of the estimated future net cash flows using implied rates in the applicable yield curve as of December 31, 2019, and classified within Level 2 of the valuation hierarchy.
The table below presents information about our derivative financial instruments as of December 31, 2019 and 2018:
Weighted-Average Fixed Rate of Interest at | Range of Maturity Dates at | Fair Values at December 31, | ||||||||||||
Derivative Financial Instruments | Balance Sheet Location | December 31, 2019 | December 31, 2019 | 2019 | 2018 | |||||||||
(in thousands) | ||||||||||||||
Interest rate swaps (Notional of $250 million at December 31, 2019 and $750 million at December 31, 2018) | Prepaid expenses and other current assets | July 31, 2020 | $ | $ | ||||||||||
Interest rate swaps (Notional of $550 million at December 31, 2018) | Other noncurrent assets | N/A | N/A | $ | $ | |||||||||
Interest rate swaps (Notional of $1,550 million at December 31, 2019 and $950 million at December 31, 2018) | Other noncurrent liabilities | March 31, 2021 - December 31, 2022 | $ | $ | ||||||||||
N/A - not applicable.
The table below presents the effects of our interest rate swaps on the consolidated statements of income and comprehensive income for the years ended December 31, 2019, 2018 and 2017:
Years Ended December 31, | |||||||||||
2019 | 2018 | 2017 | |||||||||
(in thousands) | |||||||||||
Net unrealized gains (losses) recognized in other comprehensive loss | $ | ( | ) | $ | ( | ) | $ | ||||
Net unrealized losses (gains) reclassified out of other comprehensive loss to interest expense | $ | $ | ( | ) | $ | ||||||
81
At December 31, 2019, the amount of net unrealized losses in accumulated other comprehensive loss related to our interest rate swaps that is expected to be reclassified into interest expense during the next 12 months was approximately $20.2 million.
Interest Expense
Interest expense was $301.2 million, $195.5 million and $174.3 million, respectively, for the years ended December 31, 2019, 2018 and 2017.
NOTE 8—ACCOUNTS PAYABLE AND ACCRUED LIABILITIES
As of December 31, 2019 and 2018, accounts payable and accrued liabilities consisted of the following:
2019 | 2018 | ||||||
(in thousands) | |||||||
Funds held for customers | $ | $ | |||||
Compensation and benefits | |||||||
Contract liabilities | |||||||
Payment network fees | |||||||
Trade accounts payable | |||||||
Operating lease liabilities | |||||||
Interest | |||||||
Income taxes payable | |||||||
Miscellaneous taxes and withholdings | |||||||
Third-party processing fees | |||||||
Unclaimed property | |||||||
Audit and legal fees | |||||||
Settlement of common share repurchases | |||||||
Current portion of accrued buyout liability(1) | |||||||
Third-party commissions | |||||||
Other | |||||||
$ | $ | ||||||
(1) The noncurrent portion of accrued buyout liability of $34.2 million and $59.4 million is included in other noncurrent liabilities on the consolidated balance sheets as of December 31, 2019 and 2018, respectively.
At December 31, 2019, accrued liabilities (compensation and benefits) included obligations totally $37.3 million for one-time employee termination benefits resulting from Merger-related integration activities. During the year ended December 31, 2019, we recognized charges of $57.1 million for actions taken to date, which included $17.3 million of share-based compensation expense based on accelerated vesting periods for equity awards held by terminated employees. These charges are recorded within selling, general and administrative expenses in our consolidated statements of income and included within Corporate expenses for segment reporting purposes. New obligations may arise as Merger-related integration activities continue in 2020.
82
NOTE 9—INCOME TAX
The income tax expense (benefit) for the years ended December 31, 2019, 2018 and 2017 consisted of the following:
Years Ended December 31, | |||||||||||
2019 | 2018 | 2017 | |||||||||
(in thousands) | |||||||||||
Current income tax expense (benefit): | |||||||||||
Federal | $ | $ | ( | ) | $ | ||||||
State | |||||||||||
Foreign | |||||||||||
Deferred income tax expense (benefit): | |||||||||||
Federal | ( | ) | ( | ) | ( | ) | |||||
State | ( | ) | ( | ) | |||||||
Foreign | |||||||||||
( | ) | ( | ) | ( | ) | ||||||
$ | $ | $ | ( | ) | |||||||
Income tax expense allocated to noncontrolling interests was $12.3 million, $10.6 million and $8.6 million for the years ended December 31, 2019, 2018 and 2017, respectively.
The following table presents income before income taxes for the years ended December 31, 2019, 2018 and 2017:
Years Ended December 31, | |||||||||||
2019 | 2018 | 2017 | |||||||||
(in thousands) | |||||||||||
United States | $ | $ | $ | ||||||||
Foreign | |||||||||||
$ | $ | $ | |||||||||
On December 22, 2017, the United States enacted the U.S. Tax Cuts and Jobs Act of 2017 (the "2017 U.S. Tax Act"), which resulted in numerous changes, including a reduction in the U.S. federal tax rate from 35% to 21% effective January 1, 2018 and the transition of the U.S. federal tax system to a territorial regime. As part of this transition, the 2017 U.S. Tax Act imposed a one-time mandatory "transition" tax on foreign earnings not previously subjected to U.S. income tax.
Following the guidance in SAB 118, we made reasonable estimates of the effects of the 2017 U.S. Tax Act on our existing deferred tax balances and the one-time transition tax. For these items, which are further described below, we recognized a provisional net income tax benefit of $158.7 million, which was included as a component of income tax benefit in our consolidated statement of income for the year ended December 31, 2017.
We remeasured our U.S. deferred tax assets and liabilities based on the rates at which they are expected to reverse, which is now 21% instead of 35% and recorded a provisional income tax benefit of $222.4 million for the year ended December 31, 2017. The one-time transition tax established by the 2017 U.S. Tax Act is based on our total post-1986 foreign earnings and profits, offset by allowable foreign tax credits. The transition tax rate applied to our foreign earnings is based on the amount of those earnings held in cash and cash equivalents, as well as other assets. For the year ended December 31, 2017, we recorded a provisional income tax expense of $63.7 million for the transition tax on our previously deferred foreign earnings. During 2018, we continued to analyze other provisions of the 2017 U.S. Tax Act, including the effects on our foreign tax pools and resulting foreign tax credits, and reduced our estimated transition tax liability to $40.4 million, which resulted in an income tax benefit of $23.3 million. As of December 31, 2018, we had completed our accounting for the transition effects of the 2017 U.S. Tax Act.
83
Approximately $27.0 million of our undistributed foreign earnings are considered to be indefinitely reinvested outside the United States as of December 31, 2019. Because those earnings are considered to be indefinitely reinvested, no deferred income taxes have been provided thereon. If we were to make a distribution of any portion of those earnings in the form of dividends or otherwise, any such amounts would be subject to withholding taxes payable to various foreign jurisdictions; however, the amounts would not be subject to any additional U.S. income tax.
Our effective tax rates for the years ended December 31, 2019, 2018 and 2017 differ from the federal statutory rate for those periods as follows:
Years Ended December 31, | ||||||||
2019 | 2018 | 2017 | ||||||
Federal U.S. statutory rate | % | % | % | |||||
Valuation allowance | ( | ) | ||||||
Foreign interest income not subject to tax | ( | ) | ( | ) | ( | ) | ||
Tax credits | ( | ) | ( | ) | ( | ) | ||
Foreign-derived intangible income deduction | ( | ) | ( | ) | ||||
Uncertain tax positions | ( | ) | ( | ) | ( | ) | ||
Share-based compensation expense | ( | ) | ( | ) | ( | ) | ||
State income taxes, net of federal income tax benefit | ||||||||
Foreign income taxes | ( | ) | ( | ) | ( | ) | ||
Federal U.S. transition tax | ( | ) | ||||||
Federal U.S. rate reduction | ( | ) | ||||||
Other SAB 118 adjustments | ( | ) | ||||||
Other | ( | ) | ||||||
Effective tax rate | % | % | ( | )% | ||||
84
Deferred income taxes are determined based on the difference between the financial statement and tax bases of assets and liabilities using enacted tax laws and rates. Deferred income taxes as of December 31, 2019 and 2018 reflect the effect of temporary differences between the amounts of assets and liabilities for financial accounting and income tax purposes. As of December 31, 2019 and 2018, principal components of deferred tax items were as follows:
2019 | 2018 | ||||||
(in thousands) | |||||||
Deferred income tax assets: | |||||||
Lease liabilities | $ | $ | |||||
Financial instruments | |||||||
Share-based compensation expense | |||||||
Accrued expenses | |||||||
Foreign net operating loss carryforwards | |||||||
Income tax credit carryforwards | |||||||
Domestic net operating loss carryforwards | |||||||
Basis difference - U.K. business | |||||||
Other | |||||||
Less: valuation allowance | ( | ) | ( | ) | |||
Deferred tax liabilities: | |||||||
Acquired intangibles | |||||||
Property and equipment | |||||||
Partnership interests | |||||||
Right-of-use assets | |||||||
Other | |||||||
Net deferred income tax liability | $ | $ | |||||
The net deferred income taxes reflected on our consolidated balance sheets as of December 31, 2019 and 2018 are as follows:
2019 | 2018 | ||||||
(in thousands) | |||||||
Noncurrent deferred income tax asset | $ | $ | |||||
Noncurrent deferred income tax liability | |||||||
Net deferred income tax liability | $ | $ | |||||
85
A valuation allowance is provided against deferred tax assets when it is more likely than not that some portion or all of the deferred tax assets will not be realized. Changes to our valuation allowance during the years ended December 31, 2019, 2018 and 2017 are summarized below (in thousands):
Balance at December 31, 2016 | $ | ( | ) |
Allowance for foreign net operating loss carryforwards | ( | ) | |
Allowance for domestic net operating loss carryforwards | ( | ) | |
Allowance for state credit carryforwards | ( | ) | |
Rate change on domestic net operating loss and capital loss carryforwards | |||
Utilization of foreign income tax credit carryforward | |||
Balance at December 31, 2017 | ( | ) | |
Allowance for foreign net operating loss carryforwards | ( | ) | |
Allowance for domestic net operating loss carryforwards | |||
Allowance for state credit carryforwards | ( | ) | |
Balance at December 31, 2018 | ( | ) | |
Allowance for foreign net operating loss carryforwards | ( | ) | |
Allowance for foreign credit carryforwards | ( | ) | |
Allowance for state credit carryforwards | ( | ) | |
Allowance for domestic net operating loss carryforwards | ( | ) | |
Balance at December 31, 2019 | $ | ( | ) |
The increases in the valuation allowance related to both the state and foreign credit carryforwards for the year ended December 31, 2019 relate primarily to carryforward assets recognized in connection with the Merger.
Foreign net operating loss carryforwards of $176.9 million, domestic net operating loss carryforwards of $41.6 million and tax credit carryforwards of $36.1 million at December 31, 2019 will expire between December 31, 2024 and December 31, 2039, if not utilized.
We conduct business globally and file income tax returns in the U.S. federal jurisdiction and various state and foreign jurisdictions. In the normal course of business, we are subject to examination by taxing authorities around the world, including, without limitation, the United States and the United Kingdom. We are no longer subject to state income tax examinations for years ended on or before May 31, 2010, U.S. federal income tax examinations for years ended on or before May 31, 2016 and U.K. federal income tax examinations for years ended on or before May 31, 2015.
86
A reconciliation of the beginning and ending amounts of unrecognized income tax benefits, excluding penalties and interest, for the years ended December 31, 2019, 2018 and 2017 as follows:
Years Ended December 31, | |||||||||||
2019 | 2018 | 2017 | |||||||||
(in thousands) | |||||||||||
Balance at the beginning of the year | $ | $ | $ | ||||||||
Additions related to acquisitions | |||||||||||
Reductions for income tax positions of prior years | ( | ) | ( | ) | ( | ) | |||||
Settlements with income tax authorities | ( | ) | ( | ) | |||||||
Additions for income tax positions of prior years | |||||||||||
Additions based on income tax positions related to the current year | |||||||||||
Effect of foreign currency fluctuations on income tax positions | |||||||||||
Balance at the end of the year | $ | $ | $ | ||||||||
As of December 31, 2019, the total amount of gross unrecognized income tax benefits that, if recognized, would affect the provision for income taxes is $27.4 million.
NOTE 10—SHAREHOLDERS’ EQUITY
We make repurchases of our common stock mainly through the use of open market purchases. As of December 31, 2019, we were authorized to repurchase up to $473.4 million of our common stock. Information about shares repurchased and retired was as follows for the years ended December 31, 2019, 2018 and 2017:
Years Ended December 31, | |||||||||||
2019 | 2018 | 2017 | |||||||||
(in thousands, except per share amounts) | |||||||||||
Number of shares repurchased and retired | |||||||||||
Cost of shares repurchased, including commissions | $ | $ | $ | ||||||||
Average cost per share | $ | $ | $ | ||||||||
In connection with the completion of the Merger, our Articles of Incorporation were amended to increase the number of authorized shares of Global Payments common stock from 200 million to 400 million.
On February 5, 2019, the board of directors increased its authorization to repurchase shares of our common stock to $750 million, inclusive of prior share repurchase programs authorized by the board and repurchases made thereunder.
On February 19, 2020, the board of directors declared a cash dividend of $0.195 per share payable on March 27, 2020 to common shareholders of record on March 13, 2020.
NOTE 11—SHARE-BASED AWARDS AND OPTIONS
We have granted nonqualified stock options and restricted stock awards to key employees, officers and directors under a long-term incentive plan, which permits grants of equity to employees, officers, directors and consultants. A total of 14.0 million shares of our common stock has been reserved and made available for issuance pursuant to awards granted under the plan. The awards are held in escrow and released upon the grantee's satisfaction of conditions of the award certificate.
87
The following table summarizes share-based compensation expense and the related income tax benefit recognized for our share-based awards and stock options:
Years Ended December 31, | |||||||||||
2019 | 2018 | 2017 | |||||||||
(in thousands) | |||||||||||
Share-based compensation expense | $ | $ | $ | ||||||||
Income tax benefit | $ | $ | $ | ||||||||
Restricted Stock
Restricted stock awards vest in equal annual installments over a three-year period and in some cases vest at the end of a three-year service period. Restricted shares cannot be sold or transferred until they have vested. The grant date fair value of restricted stock awards, which is based on the quoted market value of our common stock on the grant date, is recognized as share-based compensation expense on a straight-line basis over the vesting period.
Performance Units
Certain of our executives have been granted performance units under our long-term incentive plan. Performance units are performance-based restricted stock units that, after a performance period, may convert into common shares, which may be restricted. The number of shares is dependent upon the achievement of certain performance measures during the performance period. The target number of performance units and any market-based performance measures are set by the compensation committee of our board of directors ("Compensation Committee"). Performance units are converted only after the compensation committee certifies performance based on pre-established goals.
The Compensation Committee may set a range of possible performance-based outcomes for performance units. For awards with only performance conditions, we recognize compensation expense on a straight-line basis over the performance period using the grant date fair value of the award, which is based on the number of shares expected to be earned according to the level of achievement of performance goals. If the number of shares expected to be earned were to change at any time during the performance period, we would make a cumulative adjustment to share-based compensation expense based on the revised number of shares expected to be earned. The performance periods for awards granted generally range from one to three years.
To the extent earned, these performance units convert into unrestricted shares after performance results are certified by the Compensation Committee. We recognize share-based compensation expense based on the grant-date fair value of the performance-based restricted stock units, as determined by use of a Monte Carlo model, on a straight-line basis over the performance period.
88
The following table summarizes the changes in unvested restricted stock awards and performance units for the years ended December 31, 2019, 2018 and 2017:
Shares | Weighted-Average Grant-Date Fair Value | |||||
(in thousands) | ||||||
Unvested at December 31, 2016 | $ | |||||
Granted | ||||||
Vested | ( | ) | ||||
Forfeited | ( | ) | ||||
Unvested at December 31, 2017 | ||||||
Granted | ||||||
Vested | ( | ) | ||||
Forfeited | ( | ) | ||||
Unvested at December 31, 2018 | ||||||
Replacement Awards | ||||||
Granted | ||||||
Vested | ( | ) | ||||
Forfeited | ( | ) | ||||
Unvested at December 31, 2019 | $ | |||||
The total fair value of restricted stock and performance awards vested was $82.1 million, $43.4 million and $33.7 million for the years ended December 31, 2019, 2018 and 2017, respectively.
For restricted stock awards and performance units, we recognized compensation expense of $74.3 million, $53.2 million and $35.2 million for the years ended December 31, 2019, 2018 and 2017, respectively. As of December 31, 2019, there was $142.9 million of unrecognized compensation expense related to unvested restricted stock awards and performance units that we expect to recognize over a weighted-average period of 2.1 years. Our restricted stock and performance unit plans provide for accelerated vesting under certain conditions.
Stock Options
Stock options are granted with an exercise price equal to 100 % of fair market value of our common stock on the date of grant and have a term of ten years . Stock options vest in equal installments on each of the first three anniversaries of the grant date. Our stock option plans provide for accelerated vesting under certain conditions.
89
The following table summarizes changes in stock option activity for the years ended December 31, 2019, 2018 and 2017:
Options | Weighted-Average Exercise Price | Weighted-Average Remaining Contractual Term | Aggregate Intrinsic Value | |||||||
(in thousands) | (years) | (in millions) | ||||||||
Outstanding at December 31, 2016 | $ | $ | ||||||||
Granted | ||||||||||
Exercised | ( | ) | ||||||||
Outstanding at December 31, 2017 | ||||||||||
Granted | ||||||||||
Forfeited | ( | ) | ||||||||
Exercised | ( | ) | ||||||||
Outstanding at December 31, 2018 | ||||||||||
Replacement Awards | ||||||||||
Granted | ||||||||||
Forfeited | ( | ) | ||||||||
Exercised | ( | ) | ||||||||
Outstanding at December 31, 2019 | $ | $ | ||||||||
Options vested and exercisable at December 31, 2019 | $ | $ | ||||||||
We recognized compensation expense for stock options of $12.5 million, $2.7 million and $2.6 million during the years ended December 31, 2019, 2018 and 2017, respectively. The aggregate intrinsic value of stock options exercised during the years ended December 31, 2019, 2018 and 2017 was $28.8 million, $16.5 million and $10.1 million. As of December 31, 2019, we had $10.3 million of unrecognized compensation expense related to unvested stock options that we expect to recognize over a weighted-average period of 1.7 years.
The weighted-average grant-date fair value of stock options granted, including Replacement Awards, during the years ended December 31, 2019, 2018 and 2017 was $99.56 , $35.09 , and $23.68 , respectively. Fair value was estimated on the date of grant using the Black-Scholes valuation model with the following weighted-average assumptions:
Years Ended December 31, | ||||||||
2019 | 2018 | 2017 | ||||||
Risk-free interest rate | % | % | % | |||||
Expected volatility | % | % | % | |||||
Dividend yield | % | % | % | |||||
Expected term (years) | ||||||||
The risk-free interest rate was based on the yield of a zero coupon U.S. Treasury security with a maturity equal to the expected life of the stock option from the date of the grant. Our assumption on expected volatility is based on our historical volatility. The dividend yield assumption was determined using our average common stock price over the preceding year and the annualized amount of our most current quarterly dividend per share. We based our assumption of the expected term of the stock options on the historical exercise patterns of our stock options and our expectations of future exercise patterns.
90
NOTE 12—SUPPLEMENTAL CASH FLOW INFORMATION
Supplemental cash flow disclosures for the years ended December 31, 2019, 2018 and 2017 are as follows:
Years Ended December 31, | |||||||||||
2019 | 2018 | 2017 | |||||||||
(in thousands) | |||||||||||
Income taxes paid, net of refunds | $ | $ | $ | ||||||||
Interest paid | $ | $ | $ | ||||||||
NOTE 13—NONCONTROLLING INTERESTS
The following table presents the reconciliation of net income attributable to noncontrolling interests to comprehensive income attributable to noncontrolling interests for the years ended December 31, 2019, 2018 and 2017:
Years Ended December 31, | |||||||||||
2019 | 2018 | 2017 | |||||||||
(in thousands) | |||||||||||
Net income attributable to noncontrolling interests | $ | $ | $ | ||||||||
Foreign currency translation attributable to noncontrolling interests | (2,725 | ) | ( | ) | |||||||
Comprehensive income attributable to noncontrolling interests | $ | $ | $ | ||||||||
NOTE 14—ACCUMULATED OTHER COMPREHENSIVE LOSS
The changes in the accumulated balances for each component of other comprehensive income (loss), net of tax, were as follows for the years ended December 31, 2019, 2018 and 2017:
Foreign Currency Translation | Net Unrealized Gains (Losses) on Hedging Activities | Other | Accumulated Other Comprehensive Loss | ||||||||||||
(in thousands) | |||||||||||||||
Balance at December 31, 2016 | $ | ( | ) | $ | ( | ) | $ | ( | ) | $ | ( | ) | |||
Other comprehensive income (loss) | ( | ) | |||||||||||||
Balance at December 31, 2017 | ( | ) | ( | ) | ( | ) | |||||||||
Cumulative effect of adoption of new accounting standards | ( | ) | ( | ) | |||||||||||
Other comprehensive income (loss) | ( | ) | ( | ) | ( | ) | |||||||||
Balance at December 31, 2018 | ( | ) | ( | ) | ( | ) | ( | ) | |||||||
Other comprehensive income (loss) | ( | ) | ( | ) | |||||||||||
Balance at December 31, 2019 | $ | ( | ) | $ | ( | ) | $ | $ | ( | ) | |||||
NOTE 15—SEGMENT INFORMATION
Information About Profit and Assets
Prior to the completion of the Merger, we operated in three reportable segments: North America, Europe and Asia-Pacific. In the fourth quarter of 2019, as a result of the merger with TSYS, we realigned our executive management and organizational structures. Based on an evaluation performed in accordance with the guidance provided in Accounting Standards Codification Topic 280, Segment Reporting, we determined that our new reportable segments as of December 31, 2019 were: Merchant Solutions,
91
Issuer Solutions and Business and Consumer Solutions. In connection with the organizational realignment, the legacy Global Payments businesses are included in the Merchant Solutions segment with the exception of a small portion of our European business that is included in the Issuer Solutions segment. Certain operating expenses that prior to the Merger were considered "enterprise-wide" expenses and reported in Corporate are now reflected in the Merchant Solutions segment.
Our payment technology solutions are similar around the world in that we enable our customers to accept card, electronic, check and digital-based payments. Through our Merchant Solutions segment, our offerings include, but are not limited to, authorization services, settlement and funding services, customer support and help-desk functions, chargeback resolution, terminal rental, sales and deployment, payment security services, consolidated billing and statements and on-line reporting. In addition, we offer a wide array of enterprise software solutions that streamline business operations to customers in numerous vertical markets. We also provide a variety of value-added services, including analytic and engagement tools, payroll services and reporting that assist our customers with driving demand and operating their businesses more efficiently.
Through our Issuer Solutions segment, we provide solutions that enable financial institutions and retailers to manage their card portfolios, reduce technical complexity and overhead and offer a seamless experience for cardholders on a single platform. In addition, we provide flexible commercial payments and ePayables solutions that support business-to-business payment processes for businesses and governments. We also offer complementary services including account management and servicing, fraud solution services, analytics and business intelligence, cards, statements and correspondence, customer contact solutions and risk management solutions.
Through our Business and Consumer Solutions segment, we provide general purpose reloadable prepaid debit and payroll cards, demand deposit accounts and other financial service solutions to the underbanked and other consumers and businesses in the United States.
We evaluate performance and allocate resources based on the operating income of each operating segment. The operating income of each operating segment includes the revenues of the segment less expenses that are directly related to those revenues. Operating overhead, shared costs and share-based compensation costs are included in Corporate. Interest and other income, interest and other expense, income tax expense and equity in income of equity method investments, net of tax, are not allocated to the individual segments. We do not evaluate the performance of or allocate resources to our operating segments using asset data. The accounting policies of the reportable operating segments are the same as those described in the Summary of Significant Accounting Policies in "Note 1 - Basis of Presentation and Summary of Significant Accounting Policies." The presentation of segment information for the years ended December 31, 2018 and 2017 has been recast to align with the segment presentation for the year ended December 31, 2019.
92
Information on segments and reconciliations to consolidated revenues, consolidated operating income and consolidated depreciation and amortization are as follows:
Years Ended December 31, | |||||||||||
2019 | 2018 | 2017 | |||||||||
(in thousands) | |||||||||||
Revenues (1)(2): | |||||||||||
Merchant Solutions | $ | $ | $ | ||||||||
Issuer Solutions | |||||||||||
Business and Consumer Solutions | |||||||||||
Segment revenues | |||||||||||
Less: intersegment revenues | ( | ) | |||||||||
Consolidated revenues | $ | $ | $ | ||||||||
Operating income (loss) (2)(3): | |||||||||||
Merchant Solutions | $ | $ | $ | ||||||||
Issuer Solutions | |||||||||||
Business and Consumer Solutions | |||||||||||
Corporate | ( | ) | ( | ) | ( | ) | |||||
Consolidated operating income | $ | $ | $ | ||||||||
Depreciation and amortization (2): | |||||||||||
Merchant Solutions | $ | $ | $ | ||||||||
Issuer Solutions | |||||||||||
Business and Consumer Solutions | |||||||||||
Corporate | |||||||||||
Consolidated depreciation and amortization | $ | $ | $ | ||||||||
(1) As more fully described in "Note 1—Basis of Presentation and Summary of Significant Accounting Policies" and "Note 3—Revenues" we adopted a new revenue accounting standard on January 1, 2018 that resulted in revenue being presented net of certain fees that we pay to third parties, including payment networks. This change in presentation affected our reported revenues and operating expenses for all periods after the year ended December 31, 2017 by the same amount and had no effect on operating income.
(2) Revenues, operating income and depreciation and amortization reflect the effects of acquired businesses from the respective dates of acquisition. For further discussion, see "Note 2—Acquisitions."
(3) During the year ended December 31, 2019, operating income for our Merchant Solutions segment reflected the effect of acquisition and integration expenses of $56.1 million. Operating loss for Corporate included acquisition and integration expenses of $199.5 million, $56.1 million and $94.6 million, respectively, during the years ended December 31, 2019, 2018 and 2017. Acquisition and integration expenses for 2019 were primarily related to the Merger.
Entity-Wide Information
As a percentage of our total consolidated revenues, revenues from external customers in the United States and the United Kingdom were 72 % and 8 %, respectively, for the year ended December 31, 2019, 67 % and 9 %, respectively, for the year ended December 31, 2018, and 66 % and 11 %, respectively, for the year ended December 31, 2017. Revenues from external customers
93
are attributed to individual countries based on the location of the customer arrangements. Our results of operations and our financial condition are not significantly reliant upon any single customer.
Long-lived assets, excluding goodwill and other intangible assets, by location as of December 31, 2019 and 2018 were as follows:
2019 | 2018 | ||||||
(in thousands) | |||||||
United States | $ | $ | |||||
Foreign countries | |||||||
$ | $ | ||||||
NOTE 16—COMMITMENTS AND CONTINGENCIES
Purchase Obligations
We have contractual obligations related to service arrangements with suppliers for fixed or minimum amounts. Future minimum payments at December 31, 2019 for purchase obligations were as follows (in thousands):
Years ending December 31: | |||
2020 | $ | ||
2021 | |||
2022 | |||
2023 | |||
2024 | |||
Thereafter | |||
Total future minimum payments | $ | ||
Legal Matters
We are party to a number of claims and lawsuits incidental to our business. In our opinion, the liabilities, if any, which may ultimately result from the outcome of such matters, individually or in the aggregate, are not expected to have a material adverse effect on our financial position, liquidity, results of operations or cash flows.
Six putative class action lawsuits challenging the Merger were filed. Two of these lawsuits, captioned Peters v. Total System Services, Inc. et al. (Case No. 4:19-cv-00114) and Wolf v. Total System Services, Inc., et al. (Case No. 4:19-cv-00115), were filed in the United States District Court for the Middle District of Georgia on July 18, 2019. The third lawsuit, captioned Drulias v. Global Payments Inc., et. al (Case No. 60774/2019) was filed in the Supreme Court of the State of New York, County of Westchester on July 19, 2019. The fourth lawsuit, captioned Hickey v. Total System Services, Inc., et al. (Civil Action No. 1:19-cv-03337-LMM) was filed in the United States District Court for the Northern District of Georgia, Atlanta Division, on July 23, 2019. The fifth lawsuit, captioned, Cason v. Total System Services, Inc., et al. (Case No. 1:19-cv-07471) was filed in the United States District Court for the Southern District of New York on August 9, 2019. The sixth lawsuit, captioned, Cheng v. Total System Services, et al. (Case No: 1:19-cv-01513-UNA) was filed in the United States District Court for the District of Delaware on August 13, 2019. The complaints filed in the lawsuits assert, among other matters, claims for filing a materially incomplete registration statement with the SEC. Global Payments and TSYS released supplemental disclosures relating to the Merger in late August 2019, and the Peters lawsuit, the Wolf lawsuit and the Cheng lawsuit have been voluntarily dismissed.
On September 23, 2019, a jury in the Superior Court of Dekalb County, Georgia, awarded Frontline Processing Corp. ("Frontline") $135.2 million in damages, costs and attorney's fees (plus interest) following a trial of a breach of contract dispute between Frontline and Global Payments, wherein Frontline alleged that Global Payments violated provisions of the parties' Referral Agreement and Master Services Agreement. The Superior Court entered a final judgment on the verdict in favor of Frontline on September 30, 2019. We believe the jury verdict is in error and Frontline’s case is completely without merit, and we are appealing
94
the decision to the Georgia Court of Appeals. While it is reasonably possible that we will incur some loss between zero and the judgment amount plus interest, we have determined that it is not probable that Global Payments has incurred a loss under the applicable accounting standard (ASC Topic 450, Loss Contingencies) as of December 31, 2019. As a result, we have not recorded a liability on the consolidated balance sheet with respect to this litigation.
Operating Taxes
We are subject to certain taxes that are not derived based on earnings (e.g., sales, gross receipts, property, value-added and other business taxes). During the course of operations, we must interpret the meaning of various operating tax regulations in the United States and in the foreign jurisdictions in which we do business. Taxing authorities in those various jurisdictions may arrive at different interpretations of applicable tax laws and regulations which could result in the payment of additional taxes in those jurisdictions.
BIN/ICA Agreements
We have entered into sponsorship or depository and processing agreements with certain banks. These agreements allow us to use the banks' identification numbers, referred to as Bank Identification Number ("BIN") for Visa transactions and an Interbank Card Association ("ICA") number for Mastercard transactions, to clear credit card transactions through Visa and Mastercard. Certain of these agreements contain financial covenants, and we were in compliance with all such covenants as of December 31, 2019.
NOTE 17—QUARTERLY CONSOLIDATED FINANCIAL INFORMATION (UNAUDITED)
Summarized quarterly results for the years ended December 31, 2019 and 2018 were as follows:
Quarters Ended | |||||||||||||||
March 31, 2019 | June 30, 2019 | September 30, 2019 | December 31, 2019 | ||||||||||||
(in thousands, except per share data) | |||||||||||||||
Revenues | $ | $ | $ | $ | |||||||||||
Operating income | |||||||||||||||
Net income | |||||||||||||||
Net income attributable to Global Payments | |||||||||||||||
Basic earnings per share attributable to Global Payments | |||||||||||||||
Diluted earnings per share attributable to Global Payments | |||||||||||||||
Quarters Ended | |||||||||||||||
March 31, 2018 | June 30, 2018 | September 30, 2018 | December 31, 2018 | ||||||||||||
(in thousands, except per share data) | |||||||||||||||
Revenues | $ | $ | $ | $ | |||||||||||
Operating income | |||||||||||||||
Net income | |||||||||||||||
Net income attributable to Global Payments | |||||||||||||||
Basic earnings per share attributable to Global Payments | |||||||||||||||
Diluted earnings per share attributable to Global Payments | |||||||||||||||
95
The quarterly financial data in the table above reflect the effects of business combinations and borrowings to fund certain of those business combinations. Notably, we completed our merger with TSYS during the quarter ended September 30, 2019. Additionally, our consolidated results reflected incremental expenses associated with the acquisition and integration of acquired businesses. See "Note 2—Acquisitions" for further discussion of our acquisitions.
Acquisition and integration expenses were $5.3 million, $14.2 million, $100.8 million and $135.3 million for the quarters ended March 31, 2019, June 30, 2019, September 30, 2019 and December 31, 2019, respectively. Acquisition and integration expenses were $18.3 million, $8.1 million, $8.2 million and $21.5 million for the quarters ended March 31, 2018, June 30, 2018, September 30, 2018 and December 31, 2018, respectively.
Results for the quarter ended September 30, 2018 reflect the effects of a net income tax benefit of $23.3 million in connection with adjustments made to accounting estimates associated with the 2017 U.S. Tax Act as further discussed in "Note 9—Income Tax."
96
GLOBAL PAYMENTS INC.
SCHEDULE II
Valuation & Qualifying Accounts
(in thousands)
(a) | (b) | (c) | (d) | (e) | ||||||||||||
Description | Balance at Beginning of Period | Additions: Charged to Costs and Expenses(2) | Deductions: Uncollectible Accounts Write-Offs (Recoveries) | Balance at End of Period | ||||||||||||
Allowance for doubtful accounts | ||||||||||||||||
December 31, 2017 | $ | $ | $ | $ | ||||||||||||
December 31, 2018 | ||||||||||||||||
December 31, 2019 | $ | $ | $ | $ | ||||||||||||
Reserve for merchant losses and sales allowances (1) | ||||||||||||||||
December 31, 2017 | $ | $ | $ | $ | ||||||||||||
December 31, 2018 | ||||||||||||||||
December 31, 2019 | $ | $ | $ | $ | ||||||||||||
Reserve for check guarantee operating losses | ||||||||||||||||
December 31, 2017 | $ | $ | $ | $ | ||||||||||||
December 31, 2018 | ||||||||||||||||
December 31, 2019 | $ | $ | $ | $ | ||||||||||||
Reserve for contract contingencies and processing errors | ||||||||||||||||
December 31, 2019 | $ | $ | $ | $ | ||||||||||||
Reserve for cardholder losses | ||||||||||||||||
December 31, 2019 | $ | $ | $ | $ | ||||||||||||
Deferred income tax asset valuation allowance | ||||||||||||||||
December 31, 2017 | $ | $ | $ | $ | ||||||||||||
December 31, 2018 | ||||||||||||||||
December 31, 2019 | $ | $ | $ | $ | ||||||||||||
(1) Included in settlement processing obligations.
(2) In addition to amounts charged to costs and expenses, amounts in this column include additions, as applicable, resulting from business combinations.
97
ITEM 9 - CHANGES IN AND DISAGREEMENTS WITH ACCOUNTANTS ON ACCOUNTING AND FINANCIAL DISCLOSURE
None.
ITEM 9A - CONTROLS AND PROCEDURES
Evaluation of Disclosure Controls and Procedures
As of December 31, 2019, management carried out, under the supervision and with the participation of our principal executive officer and principal financial officer, an evaluation of the effectiveness of the design and operation of our disclosure controls and procedures (as defined in Rules 13a-15(e) and 15d-15(e) under the Securities Exchange Act of 1934). Based on this evaluation, our principal executive officer and principal financial officer concluded that, as of December 31, 2019, our disclosure controls and procedures were effective in ensuring that information required to be disclosed by us in the reports that we file or submit under the Securities Exchange Act of 1934, as amended, is recorded, processed, summarized and reported within the time periods specified in applicable rules and forms and are designed to ensure that information required to be disclosed in those reports is accumulated and communicated to management, including our principal executive and principal financial officers, as appropriate to allow timely decisions regarding required disclosure.
Management's Report on Internal Control over Financial Reporting
Our management team is responsible for establishing and maintaining adequate internal control over financial reporting as defined in Rules 13a-15(f) and 15d-15(f) under the Securities Exchange Act of 1934. Our management assessed the effectiveness of our internal control over financial reporting as of December 31, 2019. In making this assessment, our management used the criteria set forth by the Committee of Sponsoring Organizations of the Treadway Commission the Internal Control — Integrated Framework (2013).
On September 18, 2019, we consummated our merger with Total System Services, Inc. ("TSYS"). As permitted by the SEC rules and regulations, management's assessment did not include the internal control of the acquired operations of TSYS, which are included in our consolidated financial statements as of December 31, 2019 and for the period from the acquisition date through December 31, 2019. In accordance with our integration efforts, we plan to incorporate the acquired operations of TSYS into our internal control over financial reporting program within the time period provided by applicable SEC rules and regulations. The assets, excluding goodwill, of the acquired operations of TSYS constituted approximately 32% of our total consolidated assets as of December 31, 2019. Operating results of the acquired operations of TSYS comprised approximately 25% of our total consolidated revenues and approximately of 10% our consolidated operating income for the year ended December 31, 2019.
Based on the results of its evaluation, which excluded assessments of the internal control of the acquired operations of TSYS, management believes that as of December 31, 2019, our internal control over financial reporting is effective based on those criteria.
Because of its inherent limitations, internal control over financial reporting may not prevent or detect all misstatements. Projections of any evaluation of effectiveness to future periods are subject to the risk that controls may become inadequate because of changes in conditions or that the degree of compliance with the policies or procedures may deteriorate. Internal control over financial reporting cannot provide absolute assurance of achieving financial reporting objectives because of its inherent limitations. Internal control over financial reporting is a process that involves human diligence and compliance and is subject to lapses in judgment and breakdowns resulting from human failures. Internal control over financial reporting also can be circumvented by collusion or improper management override. Due to such limitations, there is a risk that material misstatements may not be prevented or detected on a timely basis by internal control over financial reporting. However, these inherent limitations are known features of the financial reporting process. Therefore, it is possible to design into the process safeguards to reduce, though not eliminate, such risk.
Attestation Report of Public Accounting Firm
Deloitte & Touche LLP has issued an attestation report on our internal control over financial reporting, which is included herein as the Report of Independent Registered Public Accounting Firm under Item 8 - Financial Statements and Supplementary Data for the year ended December 31, 2019.
98
Changes in Internal Control over Financial Reporting
During the quarter ended December 31, 2019, as part of our ongoing integration activities following the Merger, we continued to apply our controls and procedures to the TSYS business and to augment our company-wide controls to address the risks inherent in an acquisition of this magnitude.
PART III
ITEM 10 - DIRECTORS, EXECUTIVE OFFICERS AND CORPORATE GOVERNANCE
We incorporate by reference in this Item 10 information about our directors, executive officers and our corporate governance contained under the headings "Proposal 1: Election of Directors" and "Biographical Information About Our Executive Officers" and information about compliance with Section 16(a) of the Securities and Exchange Act of 1934 by our directors and executive officers under the heading "Delinquent Section 16(a) Reports" from our proxy statement to be delivered in connection with our 2020 Annual Meeting of Shareholders to be held on April 29, 2020 ("2020 Proxy Statement").
We have adopted codes of ethics that apply to our senior financial officers. The senior financial officers include our Chief Executive Officer, Chief Financial Officer, Chief Accounting Officer, Controller or persons performing similar functions. The code of ethics is available in the investor relations section of our website at www.globalpaymentsinc.com and as indicated in the section entitled "Where To Find Additional Information" in Part I to this Annual Report. We intend to satisfy the disclosure requirement under Item 5.05 of Form 8-K regarding an amendment to, or a waiver from, a provision of our code of ethics by posting such information on our website at the address and location set forth above.
ITEM 11 - EXECUTIVE COMPENSATION
We incorporate by reference in this Item 11 the information relating to executive and director compensation and the report of the Compensation Committee contained under the headings "Compensation Discussion and Analysis" and "Board and Corporate Governance-Director Compensation" from our 2020 Proxy Statement.
ITEM 12 - SECURITY OWNERSHIP OF CERTAIN BENEFICIAL OWNERS AND MANAGEMENT AND RELATED STOCKHOLDER MATTERS
We incorporate by reference in this Item 12 the information relating to ownership of our common stock by certain persons contained under the headings "Common Stock Ownership-Common Stock Ownership by Management" and "Common Stock Ownership-Common Stock Ownership by Non-Management Shareholders" from our 2020 Proxy Statement.
The following table provides certain information as of December 31, 2019 concerning the shares of our common stock that may be issued under existing equity compensation plans. For more information on these plans, see "Note 11—Share-Based Awards and Options" in the notes to the accompanying consolidated financial statements.
Plan category | Number of securities to be issued upon exercise of outstanding options, warrants and rights (a) | Weighted-average exercise price of outstanding options, warrants and rights (b) | Number of securities remaining available for future issuance under equity compensation plans (excluding securities reflected in column (a)) (c) | ||||||
Equity compensation plans approved by security holders | 1,166,520 | $ | 58.03 | 35,375,036 | |||||
Equity compensation plans not approved by security holders | — | — | — | ||||||
Total | 1,166,520 | $ | 58.03 | 35,375,036 | |||||
The number of securities remaining available for future issuance under equity compensation plans reflected in column (c) above includes 10,242,552 shares authorized for issuance under our 2011 Amended and Restated Incentive Plan (the "2011 Incentive Plan"), all of which are available for issuance pursuant to grants of full-value stock awards, 2,076,737 shares authorized under our 2000 Employee Stock Purchase Plan (the "2000 ESPP"), 2,812 shares authorized under our Amended and Restated 2005 Incentive Plan, 22,822 shares authorized under our 2000 Non-Employee Director Stock Option Plan, 13,554,740 shares authorized under our Total System Services 2017 Omnibus Plan, 7,331,435 shares authorized under our Total System Services 2012 Omnibus Plan, 1,541,327 shares authorized under our Total System Services 2007 Omnibus Plan and 602,611 shares authorized under our
99
Amended and Restated NetSpend Holdings, Inc. 2004 Equity Incentive Plan for Options and Restricted Shares Assumed by Total System Services. We intend to issue future shares under the 2011 Incentive Plan and the 2000 ESPP only.
ITEM 13 - CERTAIN RELATIONSHIPS AND RELATED TRANSACTIONS, AND DIRECTOR INDEPENDENCE
We incorporate by reference in this Item 13 the information regarding certain relationships and related transactions between us and our affiliates and the independence of our directors contained under the headings "Additional Information--Relationships and Related Party Transactions" and "Board and Corporate Governance-Board Independence" from our 2020 Proxy Statement.
ITEM 14 - PRINCIPAL ACCOUNTING FEES AND SERVICES
We incorporate by reference in this Item 14 the information regarding principal accounting fees and services contained under the heading "Proposal Four: Ratification of Reappointment of Auditors" from our 2020 Proxy Statement.
PART IV
ITEM 15 - EXHIBITS, FINANCIAL STATEMENT SCHEDULES:
The following documents are filed as part of this Annual Report on Form 10-K:
(1) Consolidated Financial Statements
Our consolidated financial statements listed below are set forth in "Item 8 - Financial Statements and Supplementary Data" of this Annual Report on Form 10-K:
Page Number | |
Reports of Independent Registered Public Accounting Firm | |
Consolidated Statements of Income for the years ended December 31, 2019, 2018 and 2017 | |
Consolidated Statements of Comprehensive Income for the years ended December 31, 2019, 2018 and 2017 | |
Consolidated Balance Sheets as of December 31, 2019 and 2018 | |
Consolidated Statements of Cash Flows for the years ended December 31, 2019, 2018 and 2017 | |
Consolidated Statements of Changes in Equity for the years ended December 31, 2019, 2018 and 2017 | |
Notes to Consolidated Financial Statements | |
(2) Financial Statement Schedules
Page Number | |
Schedule II, Valuation and Qualifying Accounts | |
All other schedules to our consolidated financial statements have been omitted because they are not required under the related instruction or are inapplicable, or because we have included the required information in our consolidated financial statements or related notes.
(3) Exhibits
The following exhibits either (i) are filed with this Annual Report on Form 10-K or (ii) have previously been filed with the SEC and are incorporated in this Item 15 by reference to those prior filings.
Exhibit No. | Description |
2.1++ | |
3.1 | |
100
3.2 | |
4.1 | |
4.2 | |
4.3 | Form of Notes (included in Exhibit 4.2). |
4.4 | |
4.5 | |
4.6 | |
4.7 | |
4.8 | |
4.9 | |
4.1 | |
4.11 | |
4.12* | |
10.1 | |
10.2 | |
10.3 | |
10.4 | |
10.5 | |
10.6 | |
10.7 | |
10.8+ | |
10.9+ | |
10.10+ | |
10.11+ | |
101
10.12+ | |
10.13+ | |
10.14+ | |
10.15+ | |
10.16+ | |
10.17+ | |
10.18+ | |
10.19+ | |
10.20+ | |
10.21+ | |
10.22+ | |
10.23+ | |
10.24+ | |
10.25+ | |
10.26+ | |
10.27+ | |
10.28+ | |
10.29+ | |
10.30+ | |
21.1* | |
23.1* | |
24.1* | |
31.1* | |
31.2* | |
32.1* | |
102
101.1* | The following financial information from the Annual Report on Form 10-K for the year ended December 31, 2019, formatted in Inline XBRL (eXtensible Business Reporting Language) and filed electronically herewith: (i) the Consolidated Statements of Income; (ii) the Consolidated Statements of Comprehensive Income; (iii) the Consolidated Balance Sheets; (iv) the Consolidated Statements of Cash Flows; (v) the Consolidated Statements of Changes in Equity; and (vi) the Notes to Consolidated Financial Statements. |
104* | Cover Page Interactive Data File (formatted as Inline XBRL and contained in Exhibit 101). |
* Filed herewith.
+ Management contract or compensatory plan or arrangement.
++ Certain schedules and exhibits to this agreement have been omitted pursuant to Item 601(b)(2) of Regulation S-K and Global Payments Inc. agrees to furnish supplementally to the SEC a copy of any omitted schedule and/or exhibit upon request.
(b) Exhibits
Page Number | |
Index to Exhibits | |
(c) Financial Statement Schedules
See Item 15(2) above.
103
SIGNATURES
Pursuant to the requirements of Section 13 or 15(d) of the Securities Exchange Act of 1934, Global Payments Inc. has duly caused this report to be signed on its behalf by the undersigned, thereunto duly authorized, on February 21, 2020.
GLOBAL PAYMENTS INC. | |
By: | /s/ Jeffrey S. Sloan |
Jeffrey S. Sloan | |
Chief Executive Officer | |
(Principal Executive Officer) | |
By: | /s/ Paul M. Todd |
Paul M. Todd | |
Senior Executive Vice President and Chief Financial Officer | |
(Principal Financial Officer) | |
By: | /s/ David M. Sheffield |
David M. Sheffield | |
Senior Vice President and Chief Accounting Officer | |
(Principal Accounting Officer) | |
104
Pursuant to the requirements of the Securities Exchange Act of 1934, this report has been signed below by the following persons on behalf of Global Payments Inc. and in the capacities and on the dates indicated.
Signature | Title | Date | |||
/s/ M. Troy Woods* | Chairman of the Board | February 21, 2020 | |||
M. Troy Woods | |||||
/s/ Kriss Cloninger III* | Lead Independent Director | February 21, 2020 | |||
Kriss Cloninger III | |||||
/s/ F. Thaddeus Arroyo* | Director | February 21, 2020 | |||
F. Thaddeus Arroyo | |||||
/s/ Robert H.B. Baldwin, Jr.* | Director | February 21, 2020 | |||
Robert H.B. Baldwin, Jr. | |||||
/s/ John G. Bruno* | Director | February 21, 2020 | |||
John G. Bruno | |||||
/s/ William I Jacobs* | Director | February 21, 2020 | |||
William I Jacobs | |||||
/s/ Joia M. Johnson* | Director | February 21, 2020 | |||
Joia M. Johnson | |||||
/s/ Ruth Ann Marshall* | Director | February 21, 2020 | |||
Ruth Ann Marshall | |||||
/s/ Connie D. McDaniel* | Director | February 21, 2020 | |||
Connie D. McDaniel | |||||
/s/ William B. Plummer* | Director | February 21, 2020 | |||
William B. Plummer | |||||
/s/ John T. Turner* | Director | February 21, 2020 | |||
John T. Turner | |||||
/s/ Jeffrey S. Sloan | Director | February 21, 2020 | |||
Jeffrey S. Sloan | |||||
*By: | /s/ Jeffrey S. Sloan | Attorney-in-fact | February 21, 2020 | ||
Jeffrey S. Sloan | |||||
105